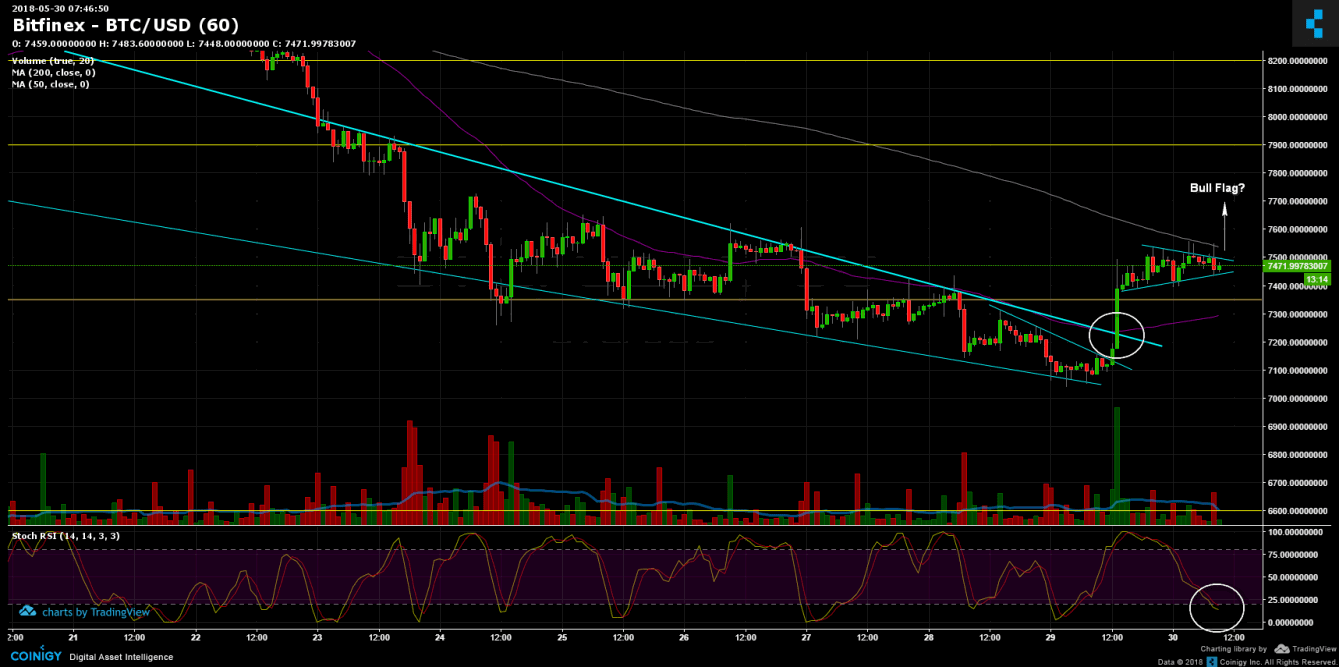
Following the 1 Day BTC chart from our previous analysis, seems like Bitcoin got supported on the $7,000 strong trend line. From there the buyers came, and the descending trend line had breached with a massive candle. If you look back, we had such candle on April 12. Shortly after, Bitcoin had reached it’s monthly top at the $10K mark.
From here, Bitcoin is forming a bull pennant which, if the pattern gets extracted (means breaking up the MA-50 resistance and the pennant), we might see testing the $8,000 very soon. From the bullish side, creating a higher low on the $9K mark is very important for the mid-long term. The short term – very strong resistance level at $7,800 – $8,000 area. From the bearish side, support levels are at $7,300 and $7,000 levels.