

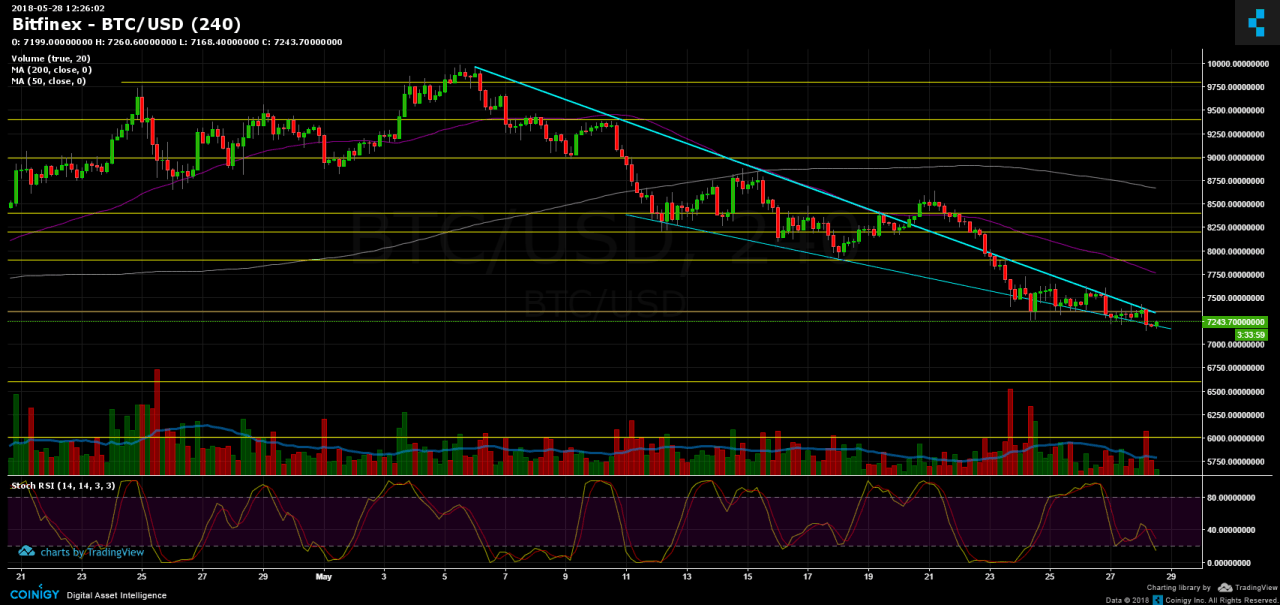
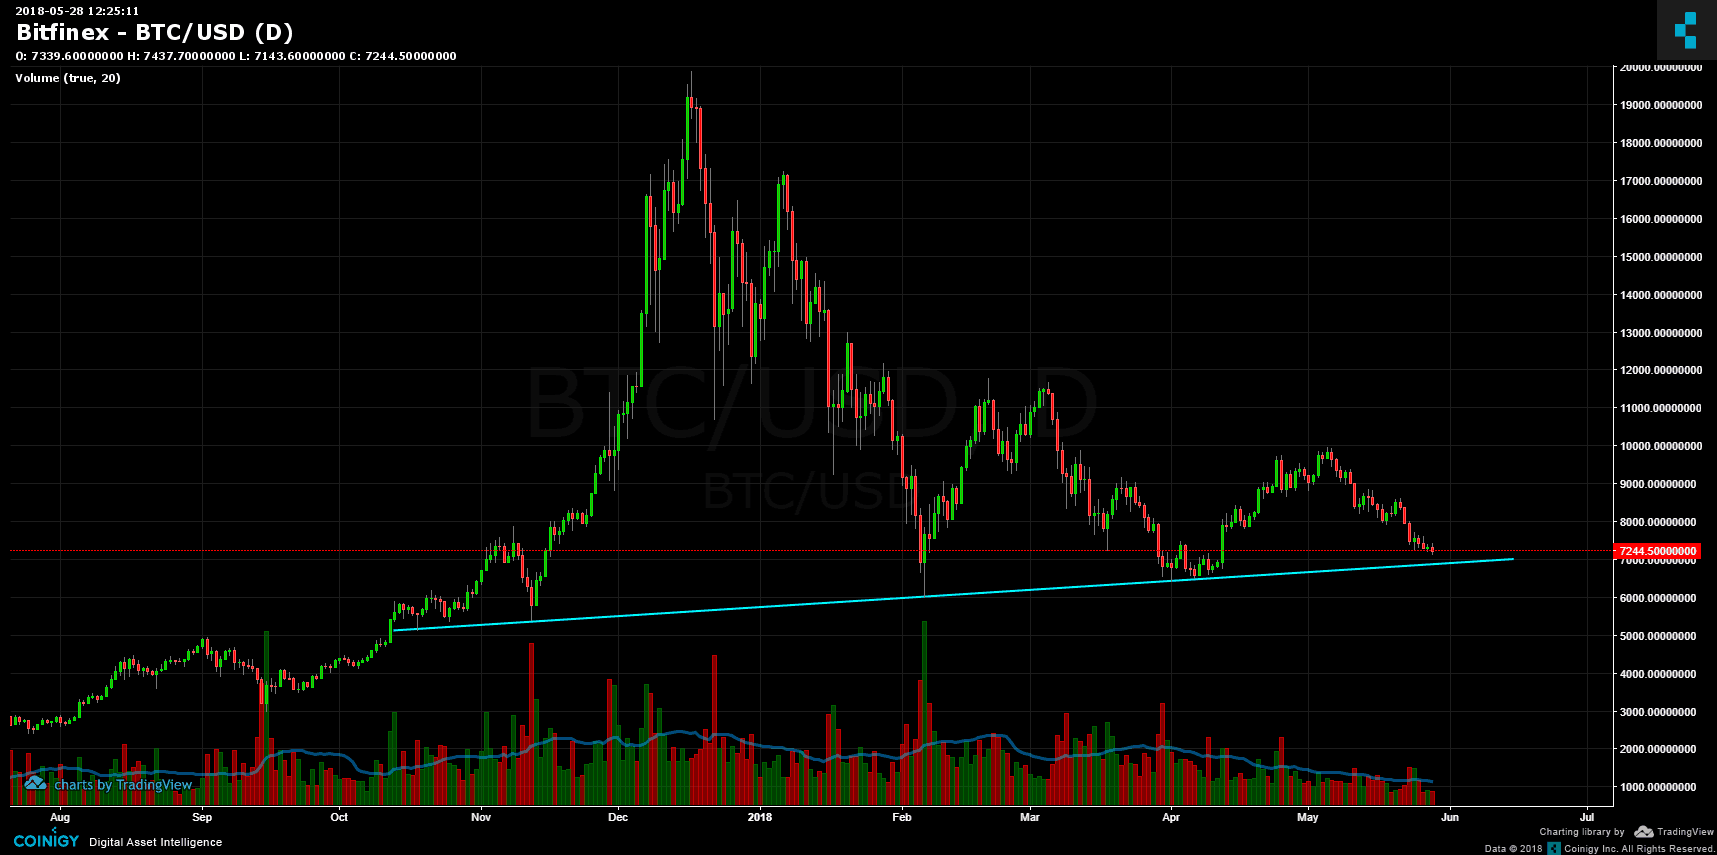
A quick update following the recent bloody days. Bitcoin is struggling around $7,200 – $7,300. The high volumes of the red candles might indicate on the strength of the sellers. Despite that, the market is over-sold, according to the RSI indicator. The more interesting is the bigger picture, or the 1 Day chart. Bitcoin is getting closer to test (again) the trend line. Breaking it down will probably lead to test the $6,600 support, and $5,900 low of 2018. From the bull side, just a reminder, is support-turned resistance at $7,800 and $8,200.
BTC/USD BitFinex 4 Hours chart
BTC/USD BitFinex 1 Day chart
Disclaimer: Information found on CryptoPotato is those of writers quoted. It does not represent the opinions of CryptoPotato on whether to buy, sell, or hold any investments. You are advised to conduct your own research before making any investment decisions. Use provided information at your own risk. See Disclaimer for more information.


