

Following the 1 Day BTC chart from our previous analysis, seems like Bitcoin got supported on the $7,000 strong trend line. From there the buyers came, and the descending trend line had breached with a massive candle. If you look back, we had such candle on April 12. Shortly after, Bitcoin had reached it’s monthly top at the $10K mark.
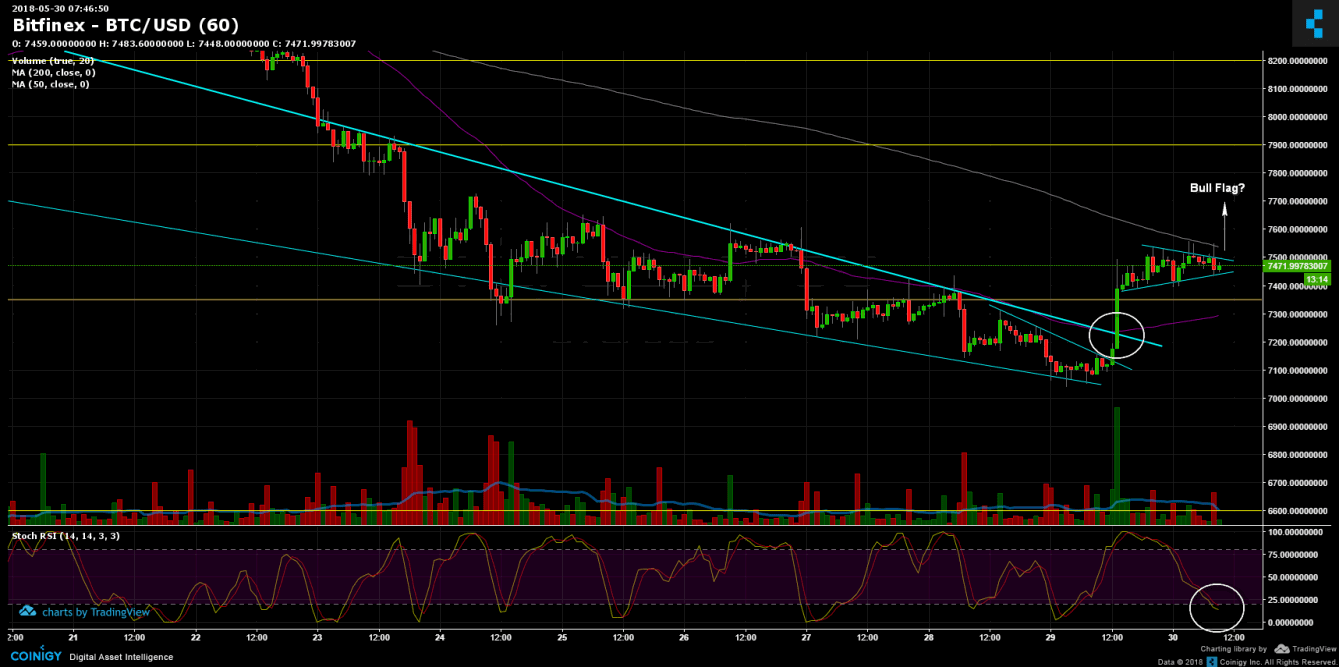
From here, Bitcoin is forming a bull pennant which, if the pattern gets extracted (means breaking up the MA-50 resistance and the pennant), we might see testing the $8,000 very soon. From the bullish side, creating a higher low on the $9K mark is very important for the mid-long term. The short term – very strong resistance level at $7,800 – $8,000 area. From the bearish side, support levels are at $7,300 and $7,000 levels.
BTC/USD BitFinex 1 Hour chart
Disclaimer: Information found on CryptoPotato is those of writers quoted. It does not represent the opinions of CryptoPotato on whether to buy, sell, or hold any investments. You are advised to conduct your own research before making any investment decisions. Use provided information at your own risk. See Disclaimer for more information.


