

For the past nine days, Bitcoin has been consolidating between the tight range of $3550 and $3650.
The overall picture hadn’t changed and is still under bearish conditions. However, two signs could change the bigger picture for the near short-term.
Regarding the open short positions, after reaching the long-term trend-line, there was a possibility of a BTC price manipulation, as happened last time when the support was tested during January 6. In this field, since our past analysis, we’ve seen a slight recovery of the shorts.
The chances for a manipulation (or “Bart”) had decreased, but the possibility still exists.
Looking at the 1-day & 4-hour charts
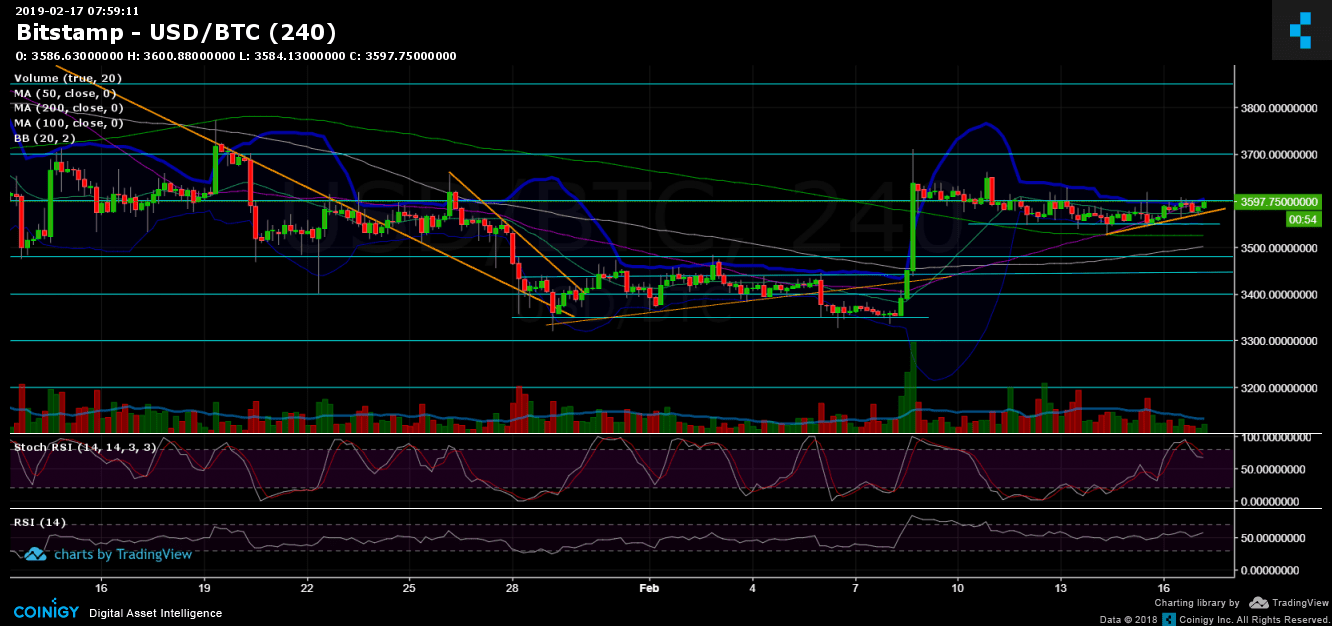
- Bollinger Bands are very tight. Hence, we are expecting a move soon.
- The 4-hour chart is forming a bullish triangle for the past three days. The formation will play-out in case of a break-up of the $3600 level followed by a high volume of buyers. A more bullish mid-term move will be in case of breaking up the crucial 50-days moving average line on the daily chart (marked in white, currently around $3620).
- The second bullish sign might be the daily chart’s RSI: After the RSI had reached support of the long-term descending trend-line, the direction had turned back up, facing now the critical 56 RSI levels. In case of a breakout, this could lead to a significant bullish move.
- Support and resistance areas: From above, the $3600 – $3620 resistance area (as mentioned above), further lies the $3700 and $3850 levels.
- From below: There is a nearby descending trend-line (currently around $3575), further down is the $3480 – $3500 significant support area. Below is the $3400 level.
- The trading volume is average to the last period, not substantial.
- As mentioned, BitFinex’s open short positions slightly increased to 23.70K BTC of open positions, following the analysis above.
BTC/USD BitStamp 4-Hour chart
BTC/USD BitStamp 1-Day chart

Disclaimer: Information found on CryptoPotato is those of writers quoted. It does not represent the opinions of CryptoPotato on whether to buy, sell, or hold any investments. You are advised to conduct your own research before making any investment decisions. Use provided information at your own risk. See Disclaimer for more information.
Cryptocurrency charts by TradingView.


