

There are hundreds of technical indicators available to traders. To trade profitably, it’s a good idea to limit your analysis to a three or four indicators that measure different aspects of the price action. Cryptocurrencies, and Bitcoin in particular, tend to follow technical indicators rules. The following three indicators take volatility, retracement levels, trend and oscillation into account.
Bollinger Bands
Bollinger Bands are indicators which plot bands that include most of the price action of a security based on its standard deviation and a moving average. The lower band is calculated by subtracting a given number of standard deviations from a given moving average. The upper band is calculated by adding the same number of standard deviations to the moving average. The most common parameters are 20 periods for the moving average, and 2 standard deviations, though any other parameters can be used.
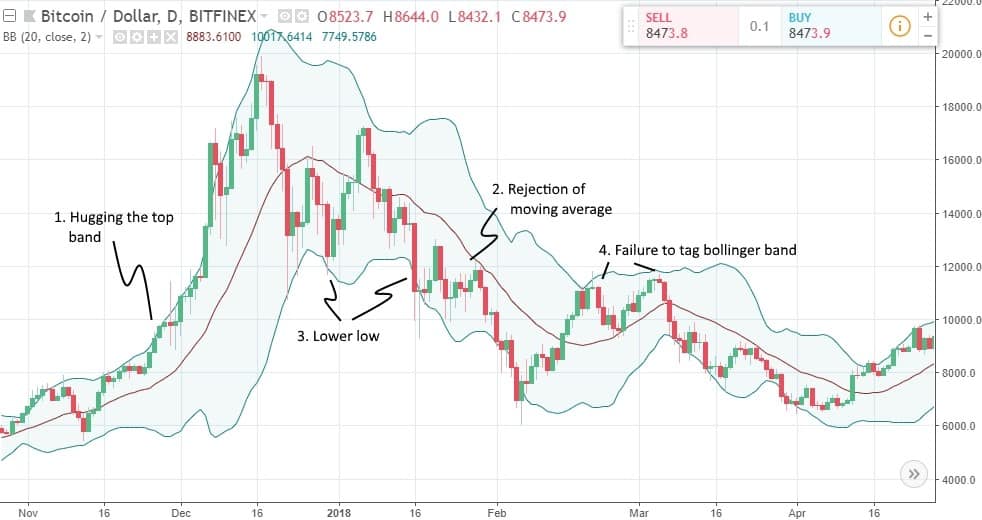
There are several ways Bollinger bands can be used by traders, and we highlight four of those methods in the chart above.
Example 1: When the price action hugs the upper band, it indicates strongly trending bullish price action. Traders can initiate long positions with a trailing stop. The reverse applies for prices hugging the lower band.
Example 2: Short positions can be initiated when the price rejects a downsloping moving average, with a target at the lower band. The reverse applies for long positions and an upsloping moving average.
Example 3: A change of trend can often be determined when the price first rejects one of the bands and then break through the band at roughly the same level. In this case, the lower Bollinger Band at first provided support, but later gave way indicating the downtrend was now in place.
Example 4: When the pattern mentioned in the previous example fails to complete, it can confirm continuation of the prior trend. In this case, the price rejected the upper band, and then on the second attempt it failed to touch the upper band, signaling that the market was still weak, and the downtrend was likely to resume.
Fibonacci Retracement
Following our previous guide, Fibonacci numbers have numerous applications for traders, but the most common is for identifying potential turning points for retracements. The most common Fibonacci (or Fib) numbers are 38.2% and 61.8%, but 50%, 78.6% and 23.6% numbers also hold occasionally.
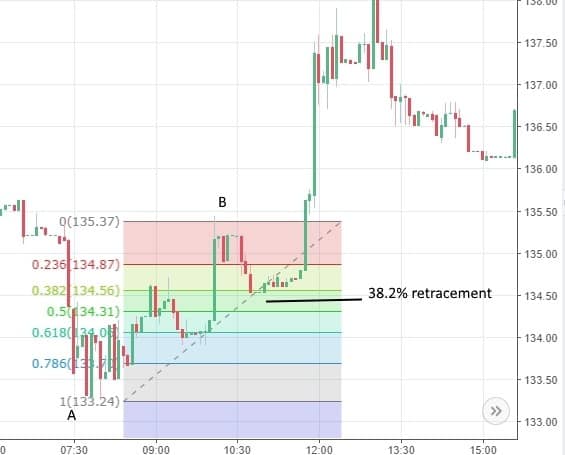
In the chart above, for LiteCoin, the price moved from A to B before beginning to retrace. Traders looking for a turning point of the retracement would look for signs of a reversal at 38.2 percent to initiate long positions. If there was no reversal at 38.2%, they would then look for a reversal at 50%, and then at 61.8%.
In this case, the price did reverse at 38.2%, setting up a long trade with an initial target at the previous high (B). A common approach would be to close half the position at the high and use a trailing stop on the remainder of the position.
Fib levels are largely psychological. They work because so many traders are watching them, and they work best in the absence of other levels or information. They also tend to repeat – if the first retracement is 38.2%, the second will often also be to 38.2%.
Commodity Channel Index
The Commodity Channel Index (or CCI) is an oscillator that compares price movements to average price movements and then represents those movements as a value above and below zero. About 80% of price action will keep the CCI between -100 and +100, and any move outside of that range would be viewed as extreme.
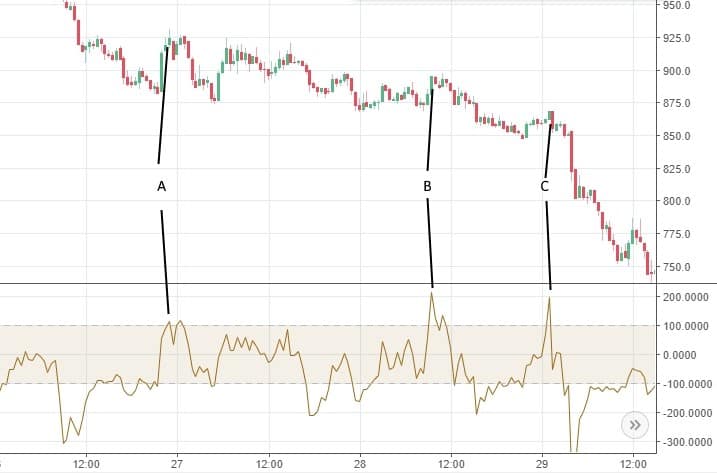
The most reliable way to trade the CCI is to first identify the trend and then trade in the direction of the trend when there is an extreme move in the opposite direction. In the above example, the trend is down. Short positions are initiated when the CCI crosses above 100 and then crosses back down to below 100. Profits can be taken when the CCI reaches -100, or short positions can be held with a trailing stop loss.
Flags and Pennants
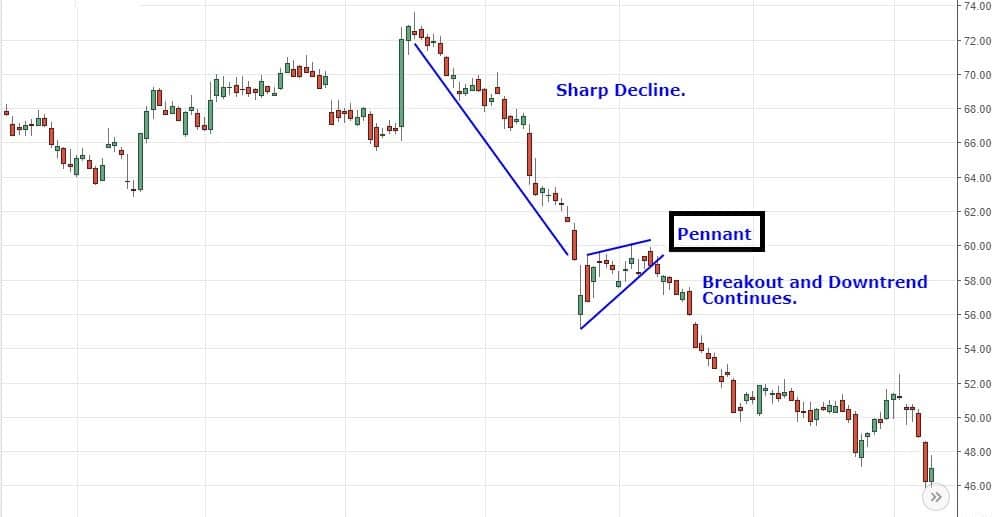
Flags and pennants are continuation patterns that marked as a short consolidation period before the preceding movement continues. The pattern is usually preceded by a sharp increase or decline in the price of the asset. Flags and pennants are often used interchangeably and are named so because of the shape that they form.
A flag or pennant is formed when the price sharply increases or decreases, followed by a slight sideways movement. This sideways movement can either form rectangular shape, a flag or a small triangle (pennant). The sharp rise or fall in the price before a flag or pennant is known as the flag pole.
Trend lines are drawn along the highs and lows of the sideways price action to determine the breakout from sideways action. When a breakout occurs, there is a strong move expected following the breakout direction.
When a flag or pennant pattern is observed, the stop loss is usually placed just below the lower trend line, in case of bullish flag. On the other hand, if the price movement is bearish in behavior, then the stop loss is placed just above the flag or pennant.
To determine the target price where the trend might break, investors can measure the price of the flag pole and then add this length to the bottom of the flag or pennant, for bullish pattern. In case of bearish pattern, the length of the flag pole is subtracted from the top of the flag or pennant.
Reward potential on trades based on flag/pennant patterns usually outweighs risk by a factor of three indicators or more. Trades should be made on upside breakouts for bullish patterns and downside breakouts for bearish patterns.
Conclusion
These are three of the most popular indicators that traders use to identify high probability opportunities to trade. They are also fur different types of indicators. The Bollinger Band considers trend and volatility, Fib levels identify potential turning points based on crowd psychology, and the CCI identifies extreme moves.
Check out our previous guide for crypto advanced technical analysis, and also our crypto technical analysis guide for beginners.
Tools to start with
TradingView: The well-known graph and charting service, wide variety of options. Mostly free, except from premium paid features.
Coinigy provides a comprehensive charting service among all trading coins and crypto exchanges. You can register following this link and get 30 days free trial.
CoinAnalyze: Brilliant website that identifies Japanese Candles’ patterns in major crypto currencies.
Special thanks to the analysts from FXEmpire for assisting in writing this article.


