The unique characteristics of the cryptocurrency markets have made technical analysis and charting invaluable tools in helping to predict direction, momentum, and support & resistance.
This article offers a brief outline on some of the more advanced popular technical analysis methods available to analyze cryptocurrency markets like Bitcoin. If you are unfamiliar with technical analysis, please read our crypto technical analysis guide for beginners.
Each has its own characteristics and investors are encouraged to study each one to determine if it fits their particular trading style and risk tolerance.
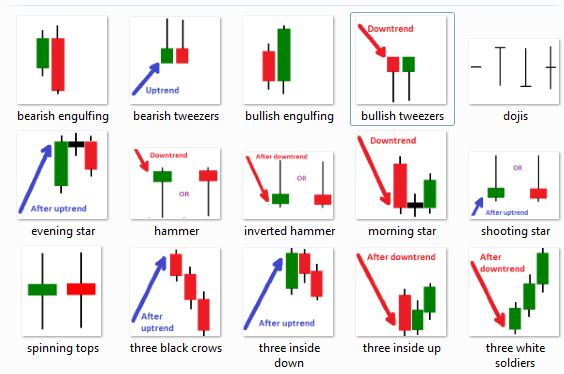
Japanese Candlesticks are a technical analysis tool that could be beneficial to cryptocurrency traders because they provide key data for traders for multiple time frames into single price bars.
Although cryptocurrencies are extremely different from traditional assets, they are still charted the same way with the price action identified by the open, high, low and close (OHLC). The OHLC uses candlesticks to build patterns that predict price direction once completed.
According to research and back-testing, there are five candlestick patterns that perform exceptionally well as precursors of price direction and momentum. Each candlestick pattern works within the context of surrounding price bars in predicting higher of lower prices.
The most accurate candlestick patterns fall into categories identified as reversals and continuations. Candlestick reversal patterns predict a change in price direction, while continuation patterns predict an extension in the current price action.
Since cryptocurrencies tend to have a strong upside bias, traders who want to use candlestick formations to improve their trading skills should focus on chart patterns that tend to predict bottoms or a continuation of the uptrend.
The five bullish candlestick patterns that investors should be focusing on during Bitcoin’s historic bull market rally, for example, are called The Hammer, The Bullish Engulfing Pattern, The Piercing Line, The Morning Star and The Three Soldiers.
The Hammer is a bullish reversal pattern, which signals that an instrument is nearing a bottom in a downtrend. Hanging Man – the opposite.
The Bullish Engulfing Pattern is a two-candle reversal pattern that appears in a downtrend.The Piercing Line also appears in a downtrend:
The Morning Star is considered a sign of hope and a new beginning in a gloomy downtrend.
The Three Soldiers Pattern is usually spotted after a period of downtrend or in price consolidation.
The Elliott Wave principle is a form of technical analysis that cryptocurrency traders use to analyze market cycles and forecast market trends by identifying extremes in investor psychology, highs and low in prices and other collective factors.
Elliott Wave traders believe that markets are affected by collective investor psychology, or crowd psychology, and that it moves between optimism and pessimism in natural sequences.
It seems to be a discipline suited for cryptocurrency traders because, at this time, they are being solely driven by investor psychology since there are no true underlying fundamentals backing its price rise other than aggressive buying due to limited supply.
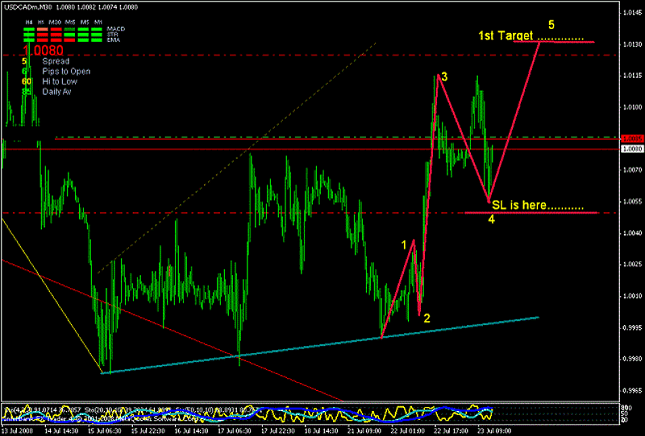
The key to success when using Elliott Wave analysis is to get the wave count right. Traders who use this technique believe the market moves in waves and that price action is primarily driven by groups of five waves as follows:
It takes years to master Elliott Wave analysis, but some cryptocurrency traders feel they have a good enough grasp of the basics to apply it to markets such as Bitcoin.
Fibonacci levels are an offshoot of Elliott Wave Analysis. Simply stated, it is a way to find possible support and resistance levels in a cryptocurrency market.
For example, after making a high/low range, traders expect a market to retrace 38.2% to 61.8% of this range to set up the next potential buying or selling opportunity. Both are Fibonacci levels.
Inversely, after making a bottom, for example, a trader will try to forecast the next rally by applying mathematics to the price action. Traders use Fibonacci level to estimate the trend length and trend’s corrections.
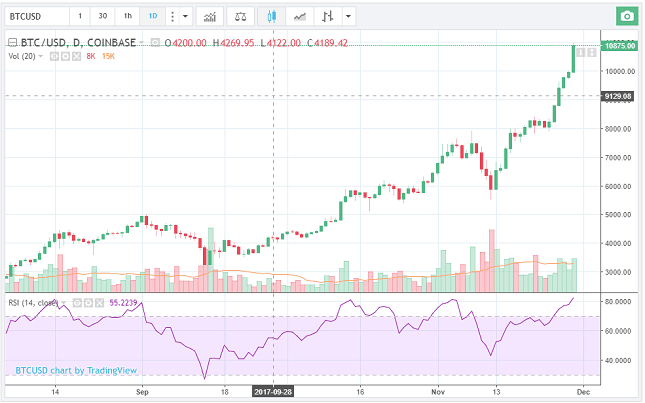
Stochastics and the Relative Strength Index (RSI) are known in the technical analysis field as oscillators because they move between a low of 0 and a high of 100. Some cryptocurrency traders use them to determine the strength of a trend or to predict tops and bottoms because of overbought and oversold conditions. As Bitcoin prices often trade in an overbought or oversold condition due to its high volatility, RSI indicator signals traders to enter or exit a certain position.
They both work under the premise that prices should be closing near the highs of trading range during upswings and toward the lower end of a trading range during downswings.
During a prolonged move down, the oscillators will near 0, indicating that a bottom may be near. During a prolonged move up, the oscillators will near 100, indicating that a top may be near. In the attached graph, Bitcoin is currently at 81.92 (RSI), meaning that Bitcoin is overbought and a correction is expected.
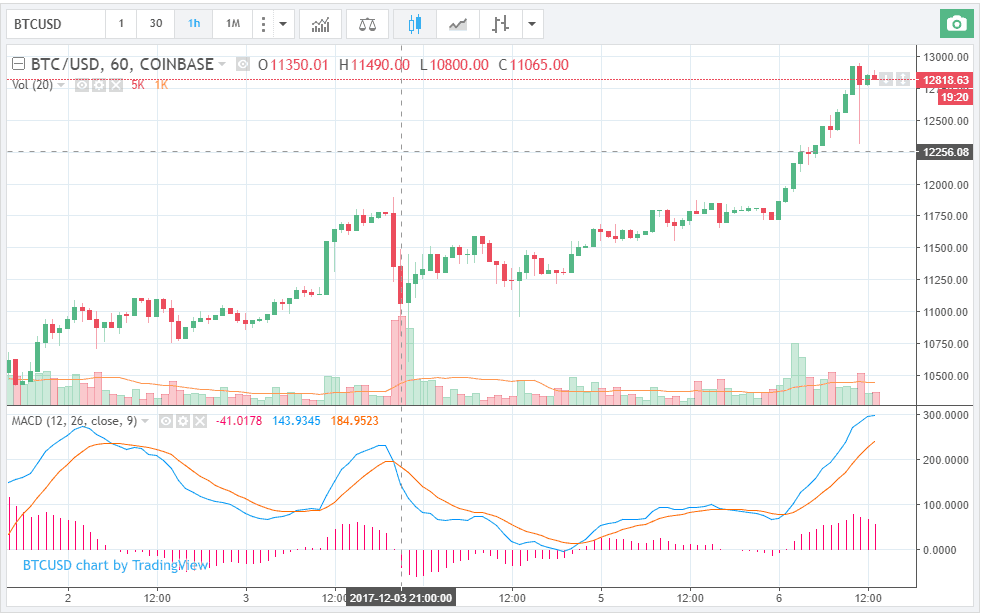
The MACD is categorized as an indicator. It is comprised of two exponential moving averages that help measure momentum in a crypto currency.
The MACD compares short-term momentum and long-term momentum in a crypto currency market to signal the current direction of momentum rather than the direction of the price.
When the MACD is positive, it signals that the crypto currency’s momentum is upward. The opposite is true when the MACD is negative.
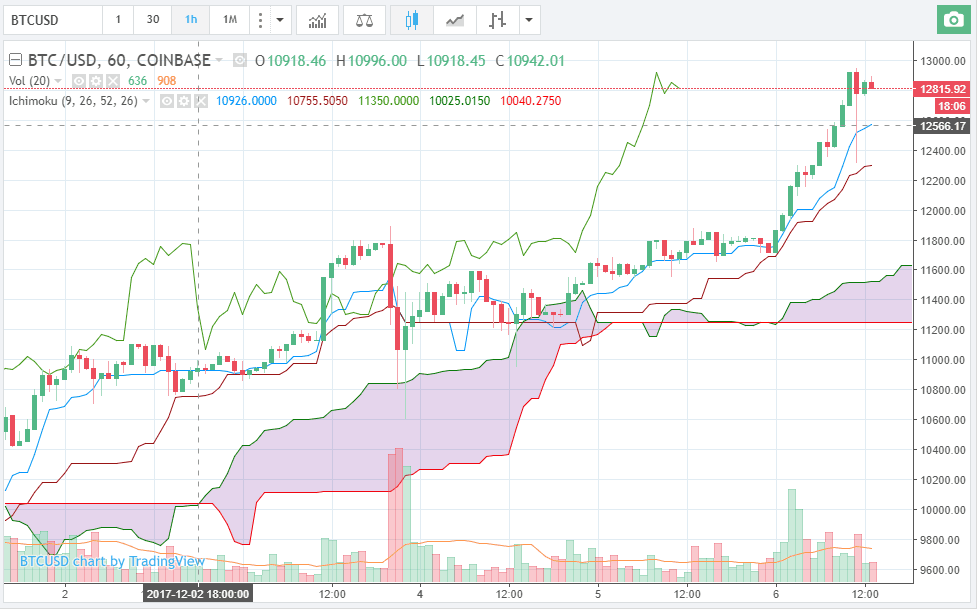
An Ichimoku Cloud is an indicator that defines support and resistance areas, identifies trend direction, gauges momentum and provides trading signals. The “clouds” are formed between spans of moving averages plotted six months ahead, and the midpoint of the 52-week high and low plotted six months ahead.
Simply stated, the overall trend is up when prices are above the cloud, down when prices are below the cloud and flat when they are in the cloud itself.
When trading crypto currencies like Bitcoin using various technical analysis tools, it is important that you have a strong conviction in what you are trying to accomplish because each technique outlined in this article has its own characteristics.
For example, if you are a trend trader and using a trend indicator tool, you may not want to cloud your analysis with an oscillator because it may be indicating that a market is overbought or oversold. In other words, learn the characteristics of each technical tool before applying them to an actual market. With the lack of fundamental, using technical analysis indicators in cryptocurrencies and, in particular, Bitcoin, is essential for every crypto trader.
TradingView: The well-known graph and charting service, wide variety of options. Mostly free, except from premium paid features.
Coinigy provides comprehensive charting service among all trading coins and crypto exchanges. You can register following this link and get 30 days free trial.
CoinAnalyze: Brilliant website that identifies Japanese Candles’ patterns in major crypto currencies.
Read here the continuation guide, discussing Bollinger bands, CCI, flags, pennants, and more.