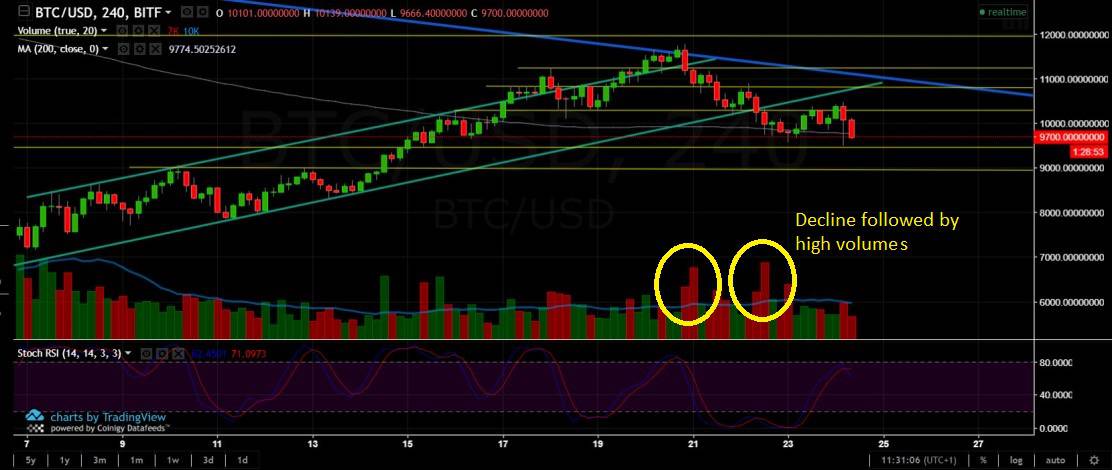
Since we’ve tested the descending line at $11,600, and failed to break it, we’re experiencing a correction down. From the Feb.21 analysis, the high volume of the red candles (marked on the chart by yellow circles) were a bad sign. We broke down the descending channel, and next support level lies at $9,400. As far as seen now, we are heading there, if not to test the $9,000 zone again.
From above, support turned resistance at $10,300 level. Further is the $10,800 resistance level, also the meeting point with the long-term descending line (marked with blue).