

Facing resistance at descending line, as mentioned in yesterday’s analysis: “It’s likely that we see a correction or consolidation. We haven’t had such since $10,300”. Bitcoin had so far failed to break up the descending line. As far as we see now, support level at $10,800 holds at the moment, but it can change quickly. What we did notice among recent red candles is that they were followed a very high trading volume, which is a bear sign. Next strong support lies at $10,000-10,300 zone – the bottom of the tunnel’s up-trend line. Breaking down the tunnel will send us back to $9,400 and then $9,000.
You should always consider both scenarios when analyzing any chart: On the bull side – breaking up the descending line will send us to resistance at $12,000, $13,000 and longer target at $17,000.
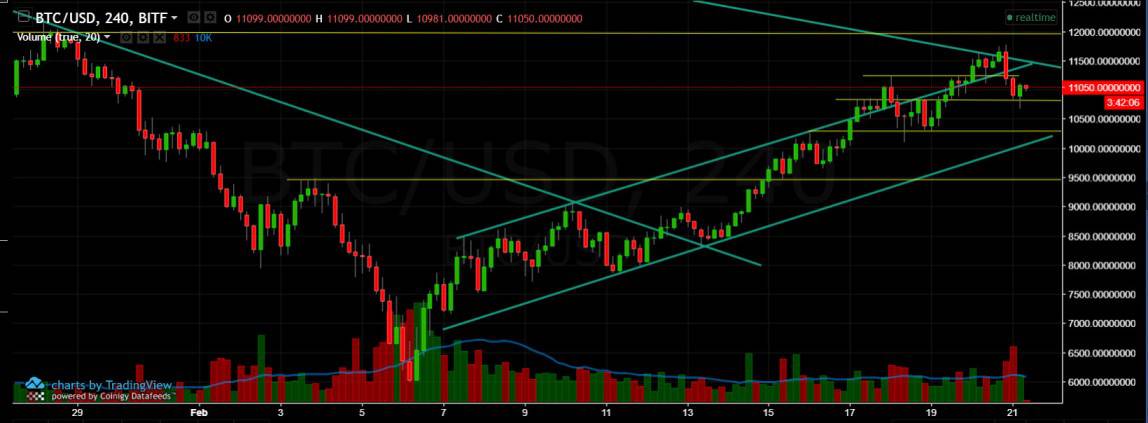
BTC/USD BitFinex 4 hours chart
Disclaimer: Information found on CryptoPotato is those of writers quoted. It does not represent the opinions of CryptoPotato on whether to buy, sell, or hold any investments. You are advised to conduct your own research before making any investment decisions. Use provided information at your own risk. See Disclaimer for more information.


