

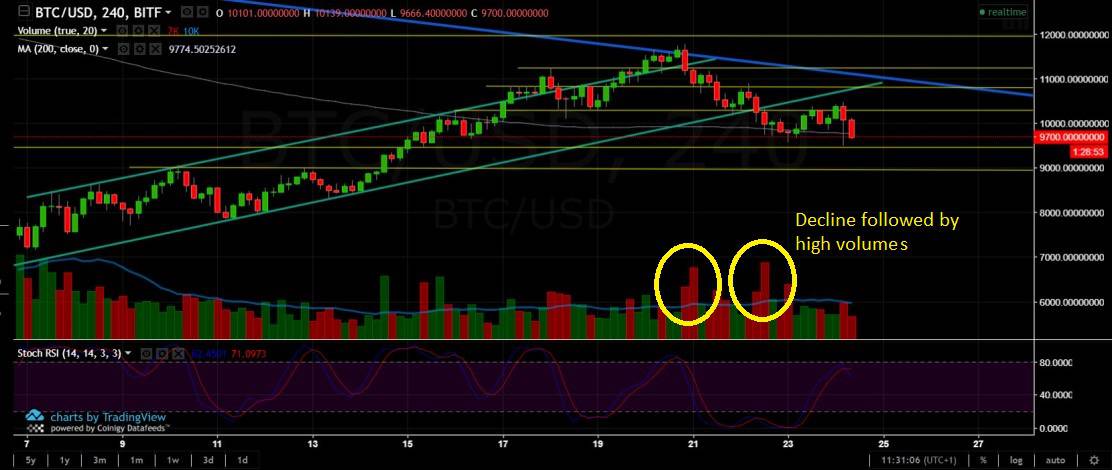
Since we’ve tested the descending line at $11,600, and failed to break it, we’re experiencing a correction down. From the Feb.21 analysis, the high volume of the red candles (marked on the chart by yellow circles) were a bad sign. We broke down the descending channel, and next support level lies at $9,400. As far as seen now, we are heading there, if not to test the $9,000 zone again.
From above, support turned resistance at $10,300 level. Further is the $10,800 resistance level, also the meeting point with the long-term descending line (marked with blue).
BTC/USD BitFinex 4 hours chart
Disclaimer: Information found on CryptoPotato is those of writers quoted. It does not represent the opinions of CryptoPotato on whether to buy, sell, or hold any investments. You are advised to conduct your own research before making any investment decisions. Use provided information at your own risk. See Disclaimer for more information.


