

Ripple continues to consolidate above the crucial support region of $0.47, navigating within a narrow range of a sideways triangle pattern.
This price action suggests potential sideways movement in the short term, with the direction of the upcoming breakout likely determining the future trend.
XRP Analysis
By Shayan
The Daily Chart
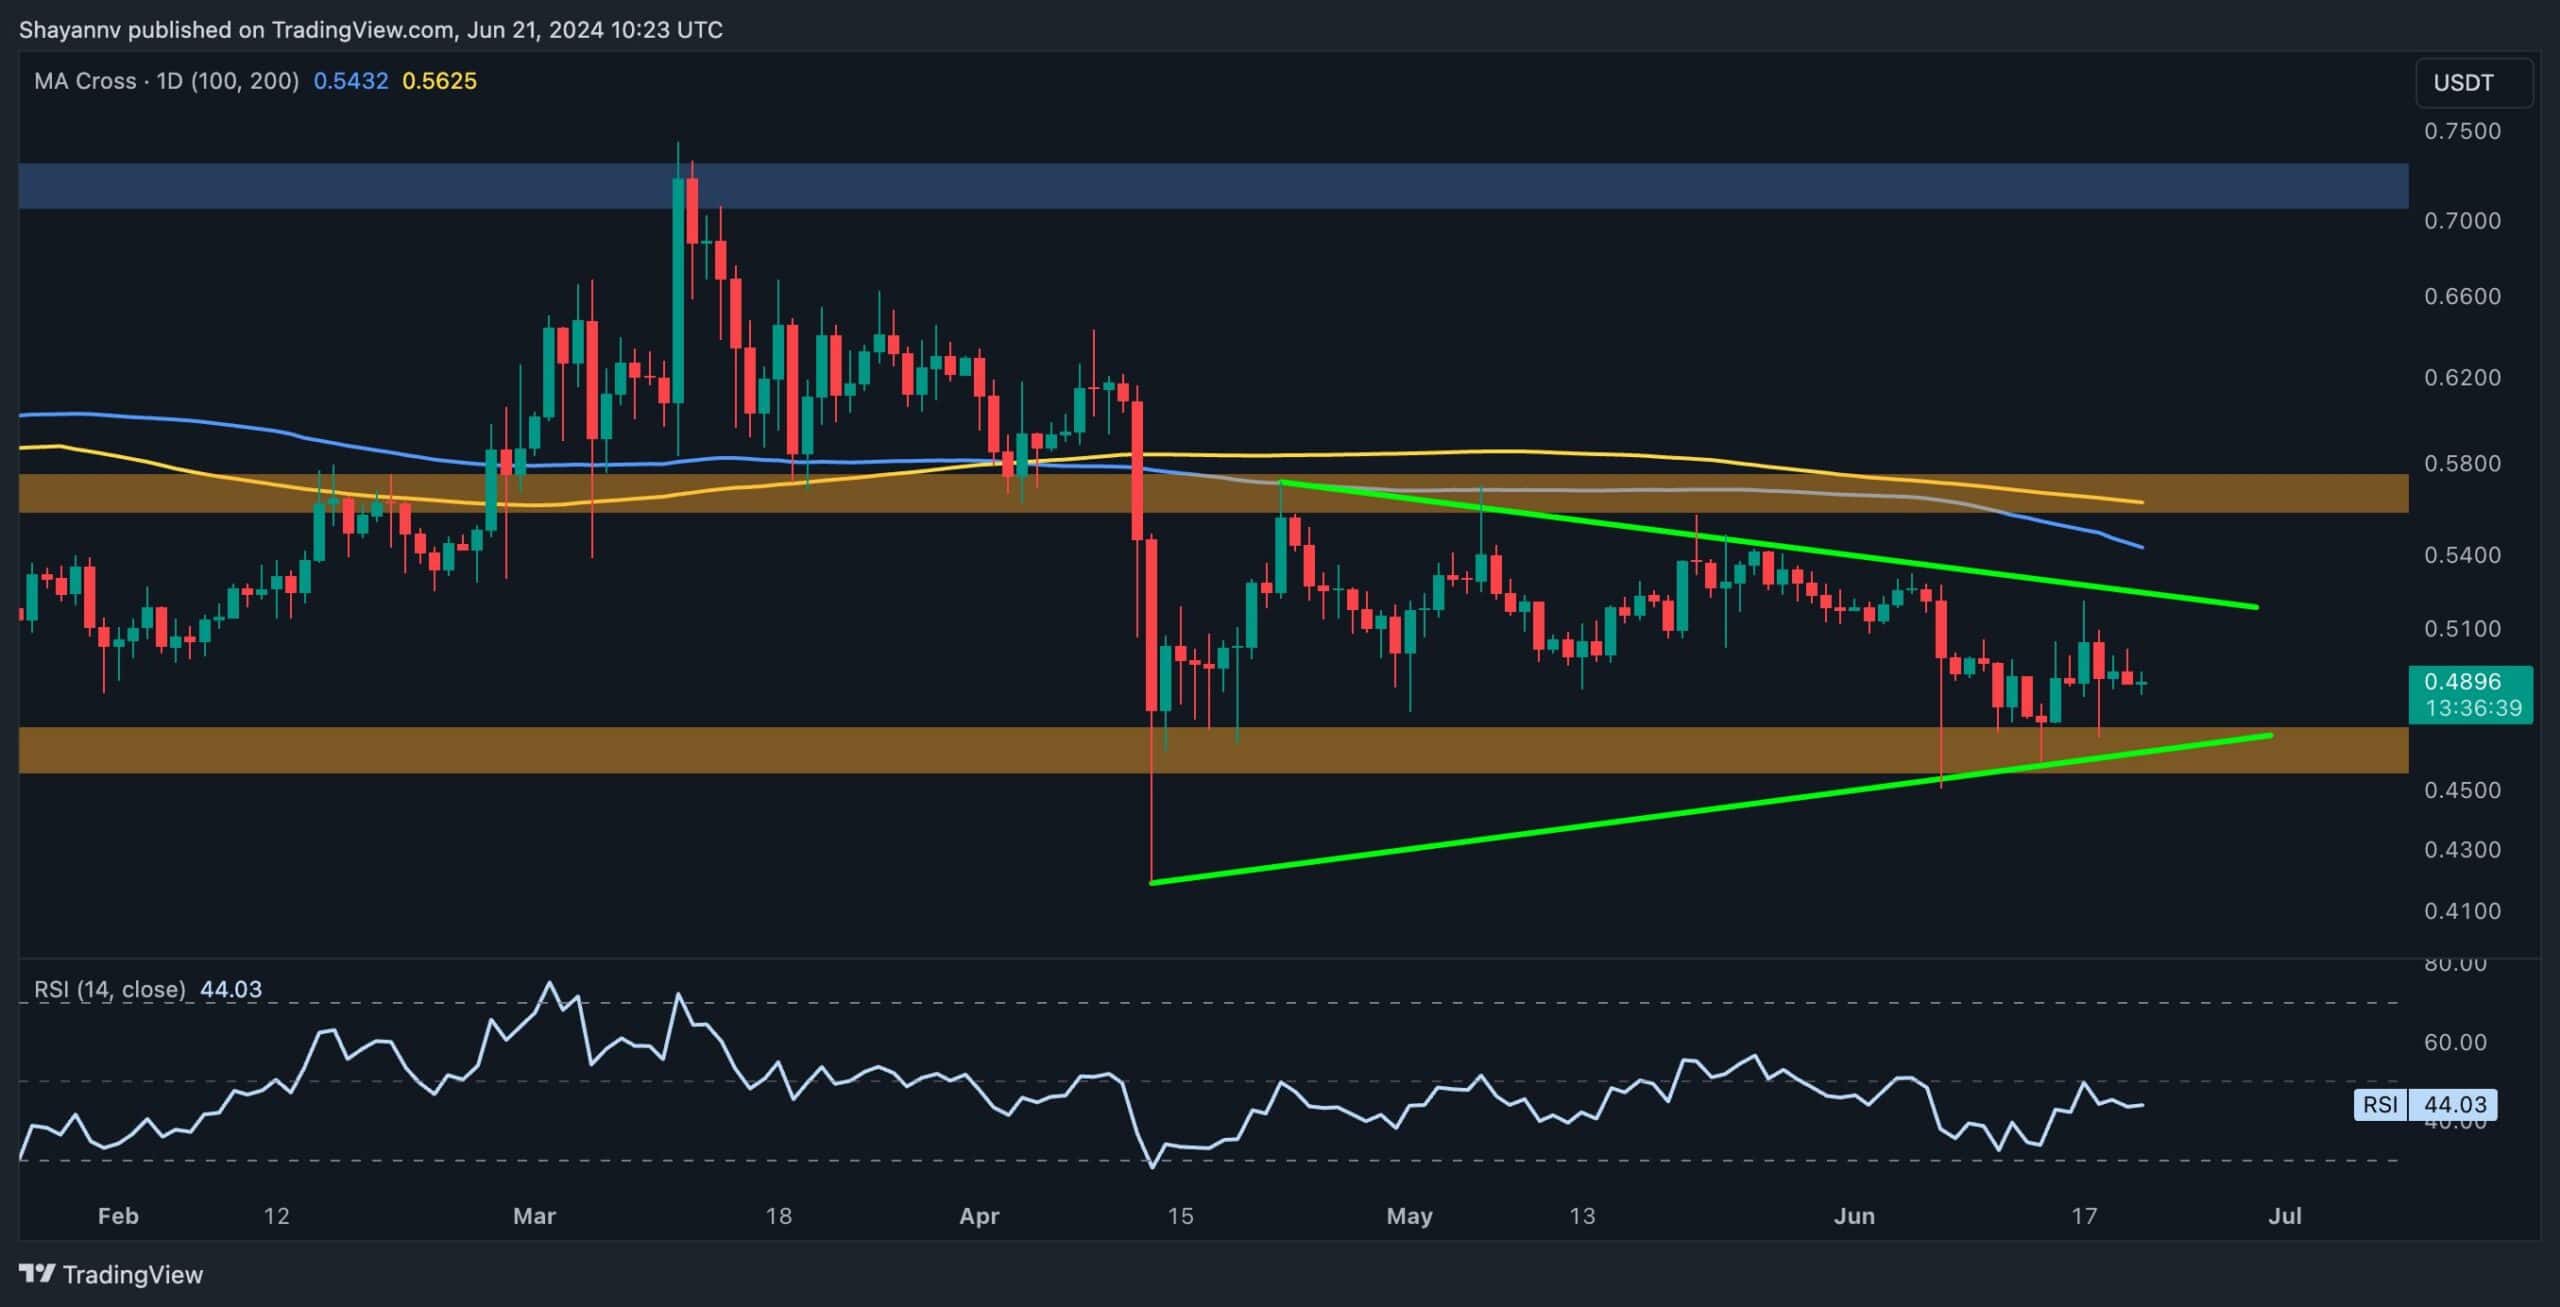
A detailed look at the daily chart shows that Ripple has been consolidating near the critical support region of $0.47, which aligns with the lower boundary of a multi-month triangle.
Recently, the price has exhibited heightened volatility near this support, approaching the narrowest range of the triangle. This scenario underscores the potential for an imminent breakout, with the direction of this breakout indicating XRP’s upcoming trajectory.
Should a bearish breakout occur, a sustained and rapid descent is likely, possibly triggering a long-squeeze event that could accelerate bearish momentum. In this case, the next target for the price would be the $0.41 threshold.
The 4-Hour Chart
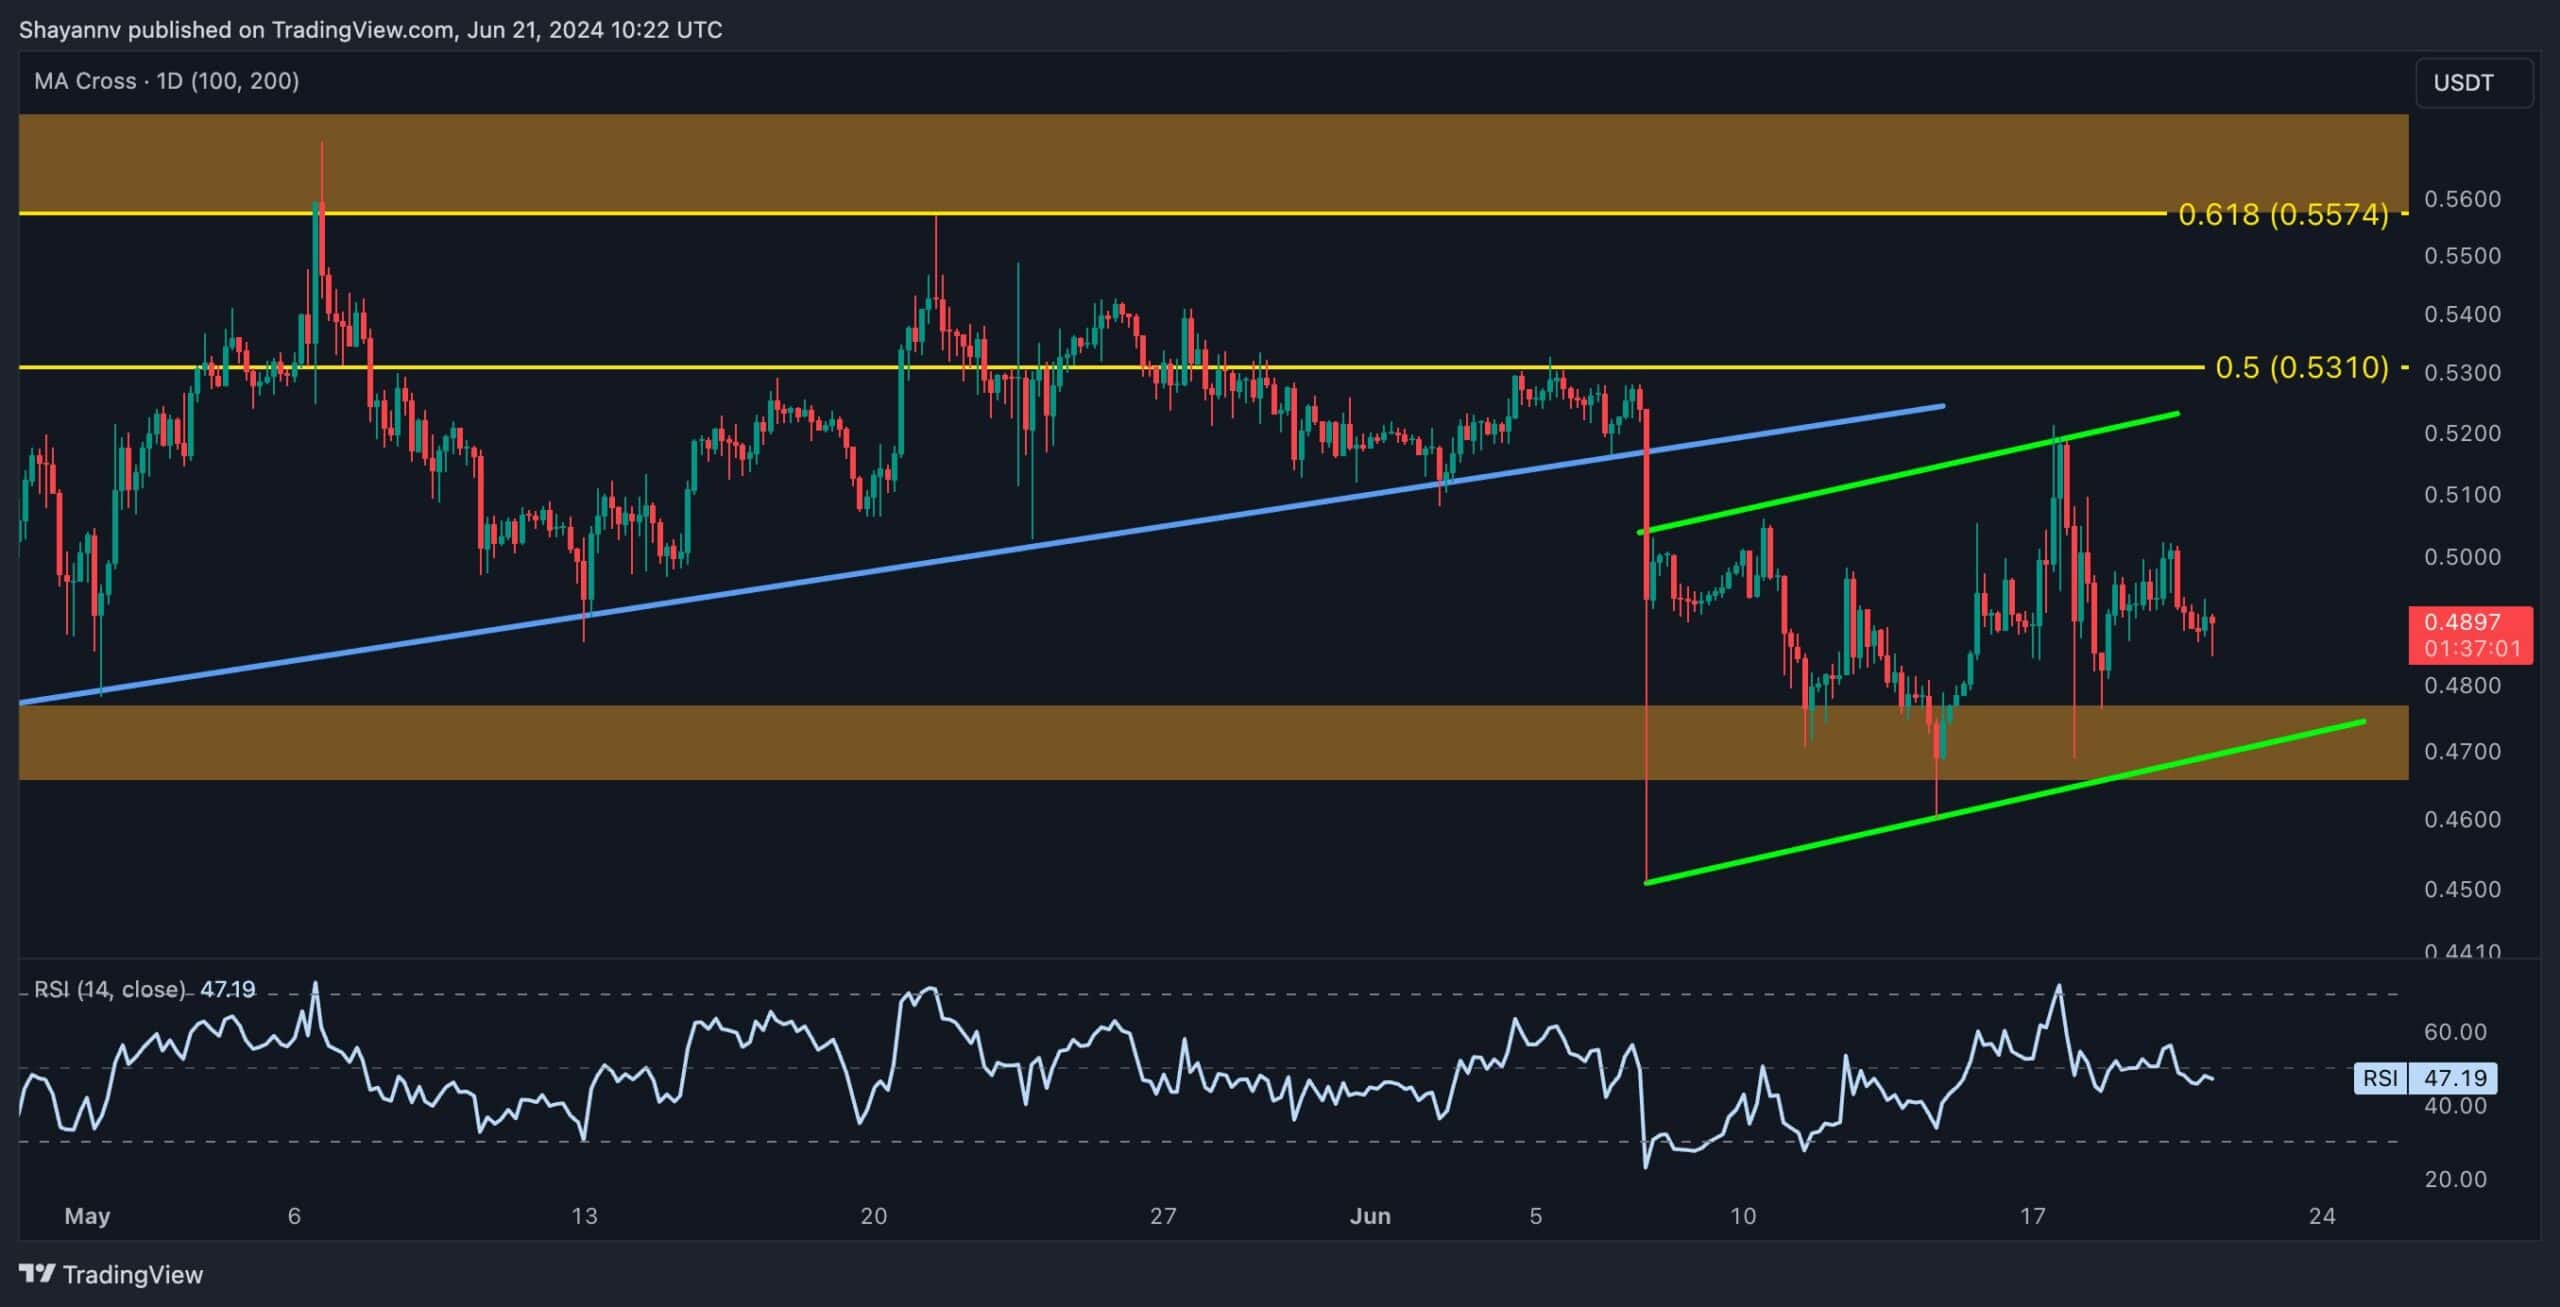
On the 4-hour chart, Ripple’s price has experienced notable fluctuations, forming an ascending flag pattern following heightened volatility near the crucial $0.47 range.
If breached from the lower trendline, this pattern typically suggests the continuation of the initial bearish movement.
If selling pressure increases and the price breaks below the pattern’s lower boundary, aligning with the crucial $0.47 mark, the bearish movement is likely to continue. The next target in this scenario would be the previous major swing low at $0.41.
LIMITED OFFER 2024 at BYDFi Exchange: Up to $2,888 welcome reward, use this link to register and open a 100 USDT-M position for free!
Disclaimer: Information found on CryptoPotato is those of writers quoted. It does not represent the opinions of CryptoPotato on whether to buy, sell, or hold any investments. You are advised to conduct your own research before making any investment decisions. Use provided information at your own risk. See Disclaimer for more information.
Cryptocurrency charts by TradingView.


