

Ripple’s price is currently testing a key area against USDT while getting rejected from another one on the Bitcoin chart.
Technical Analysis
By Edris
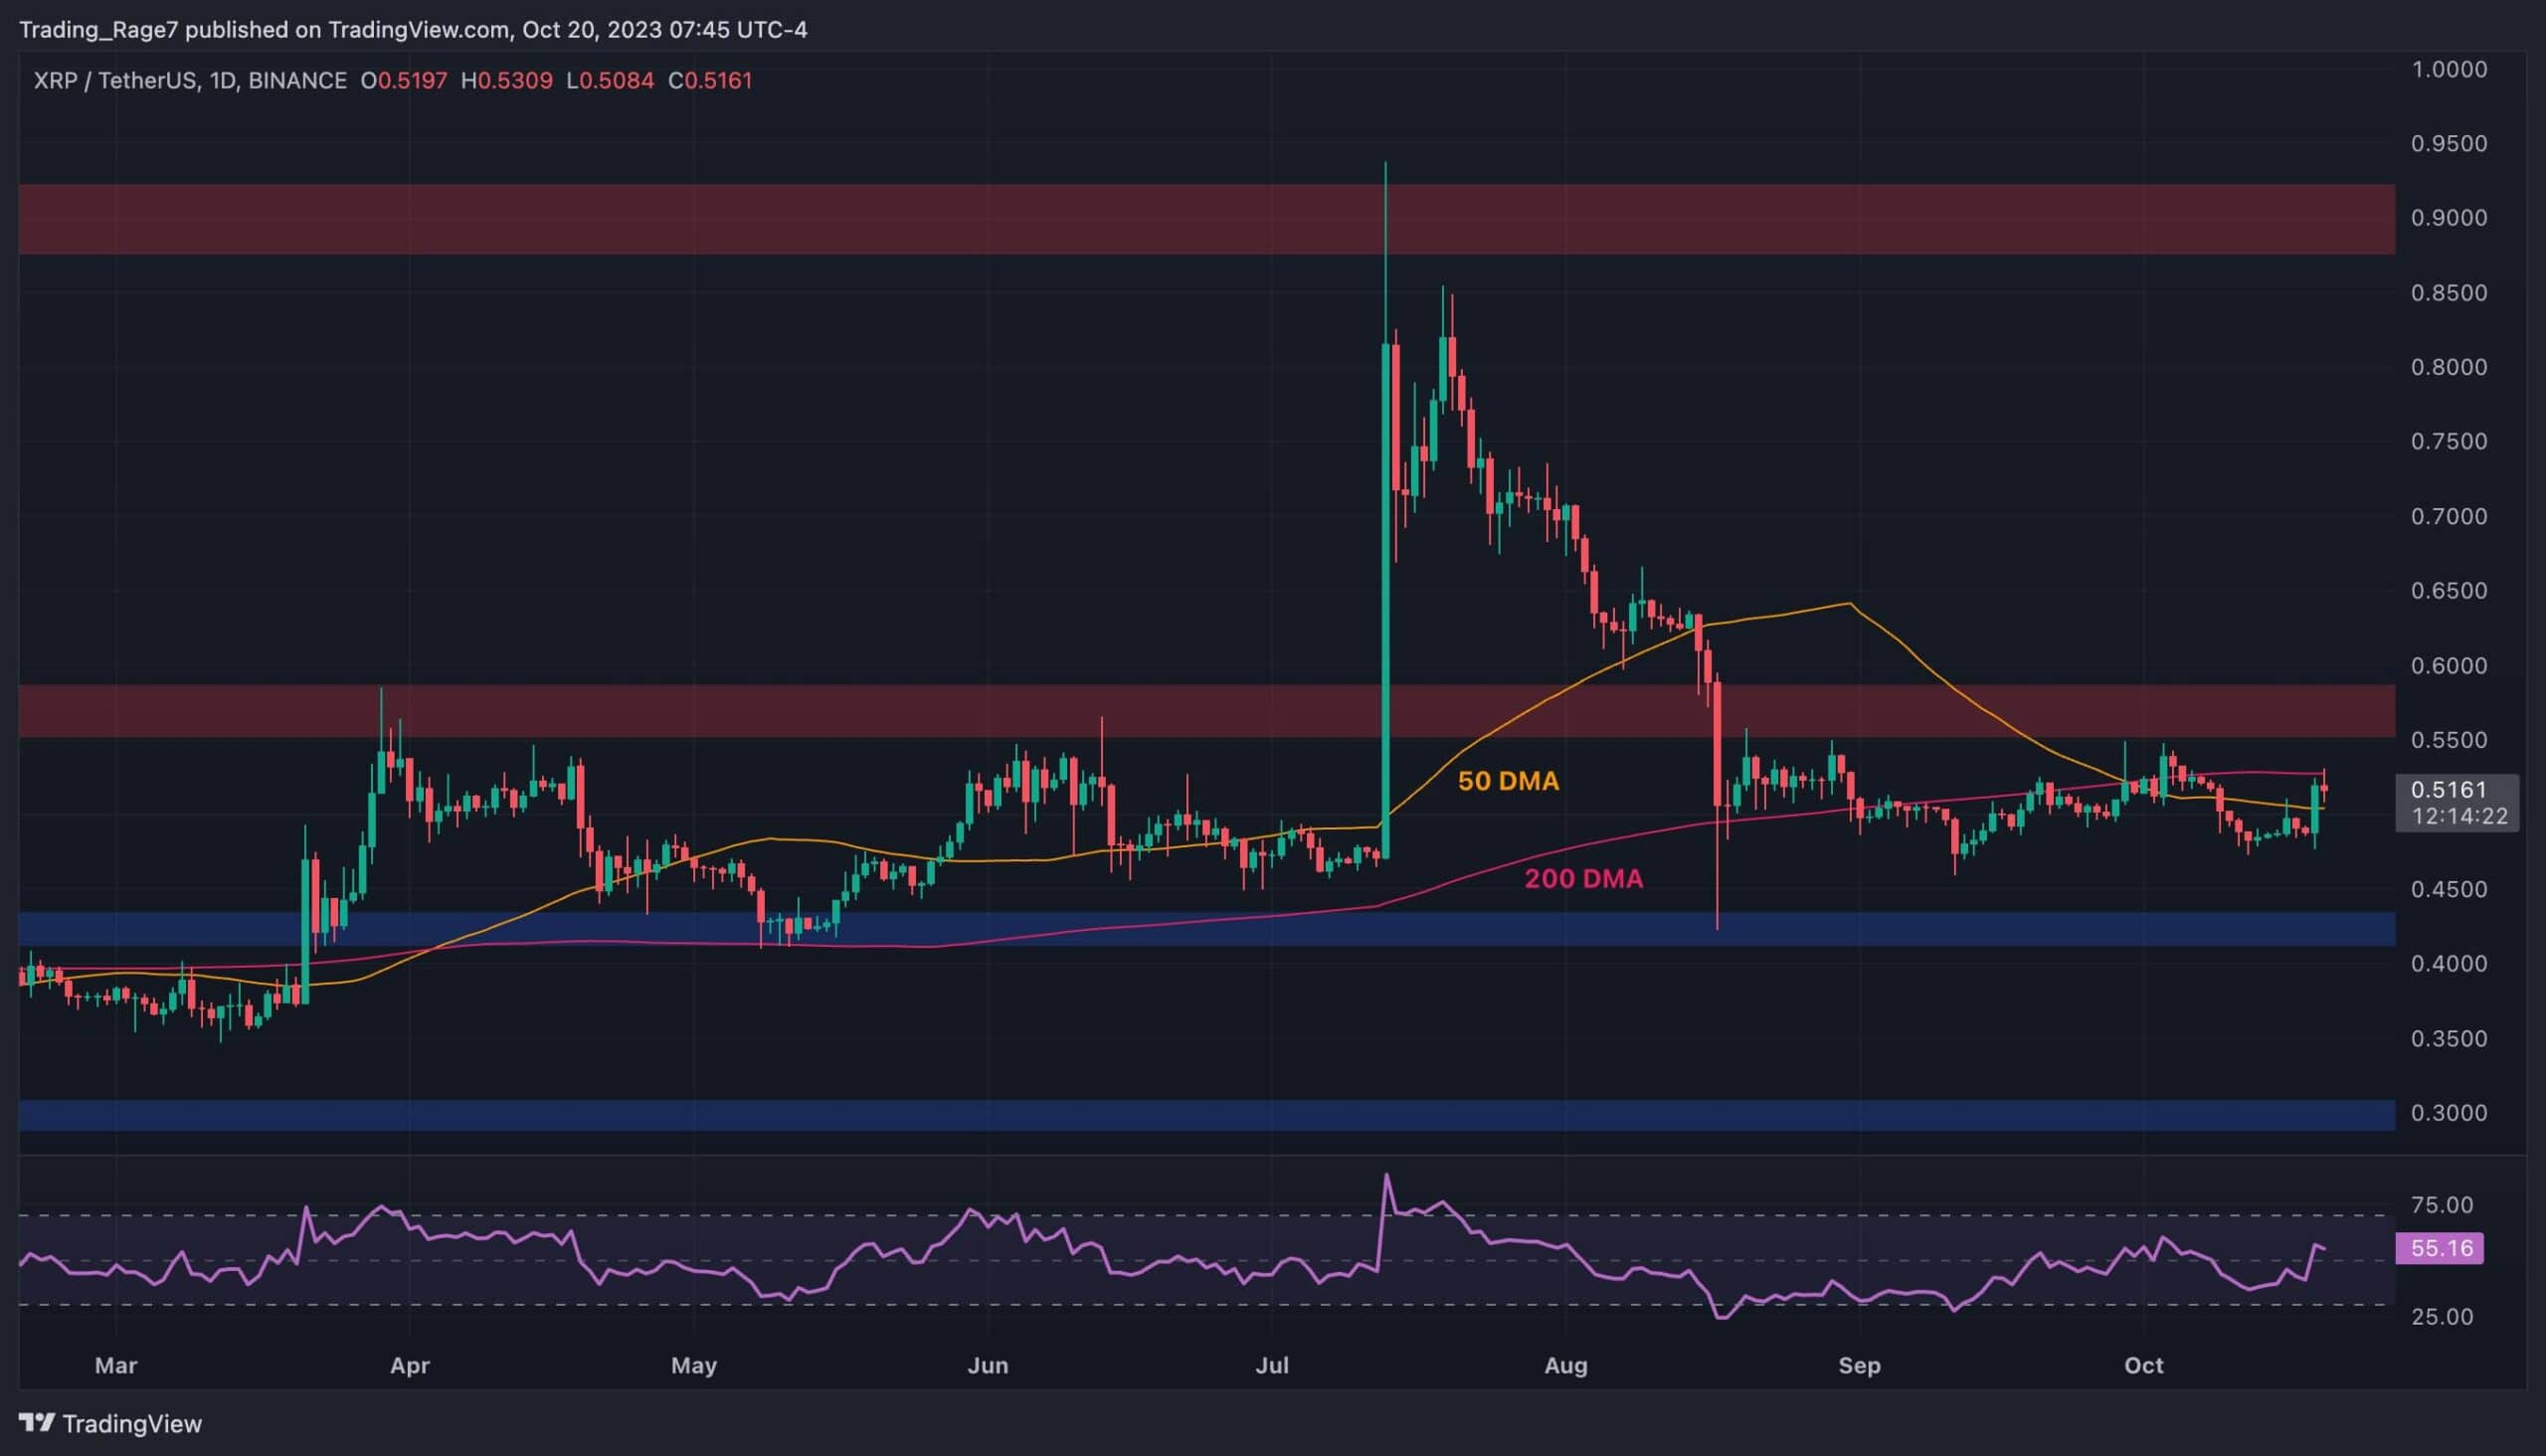
The USDT Paired Chart
Against USDT, the price saw a spike yesterday, breaking above the 50-day moving average located around the $0.50 mark. However, the 200-day moving average is preventing it from rising higher than $0.53. As long as the market is trading below the 200-day moving average, the trend cannot be considered bullish.
However, with the RSI indicator also breaking above the 50% threshold, a bullish breakout above the 200-day MA and a subsequent rally toward the $0.6 resistance level and even beyond is probable.
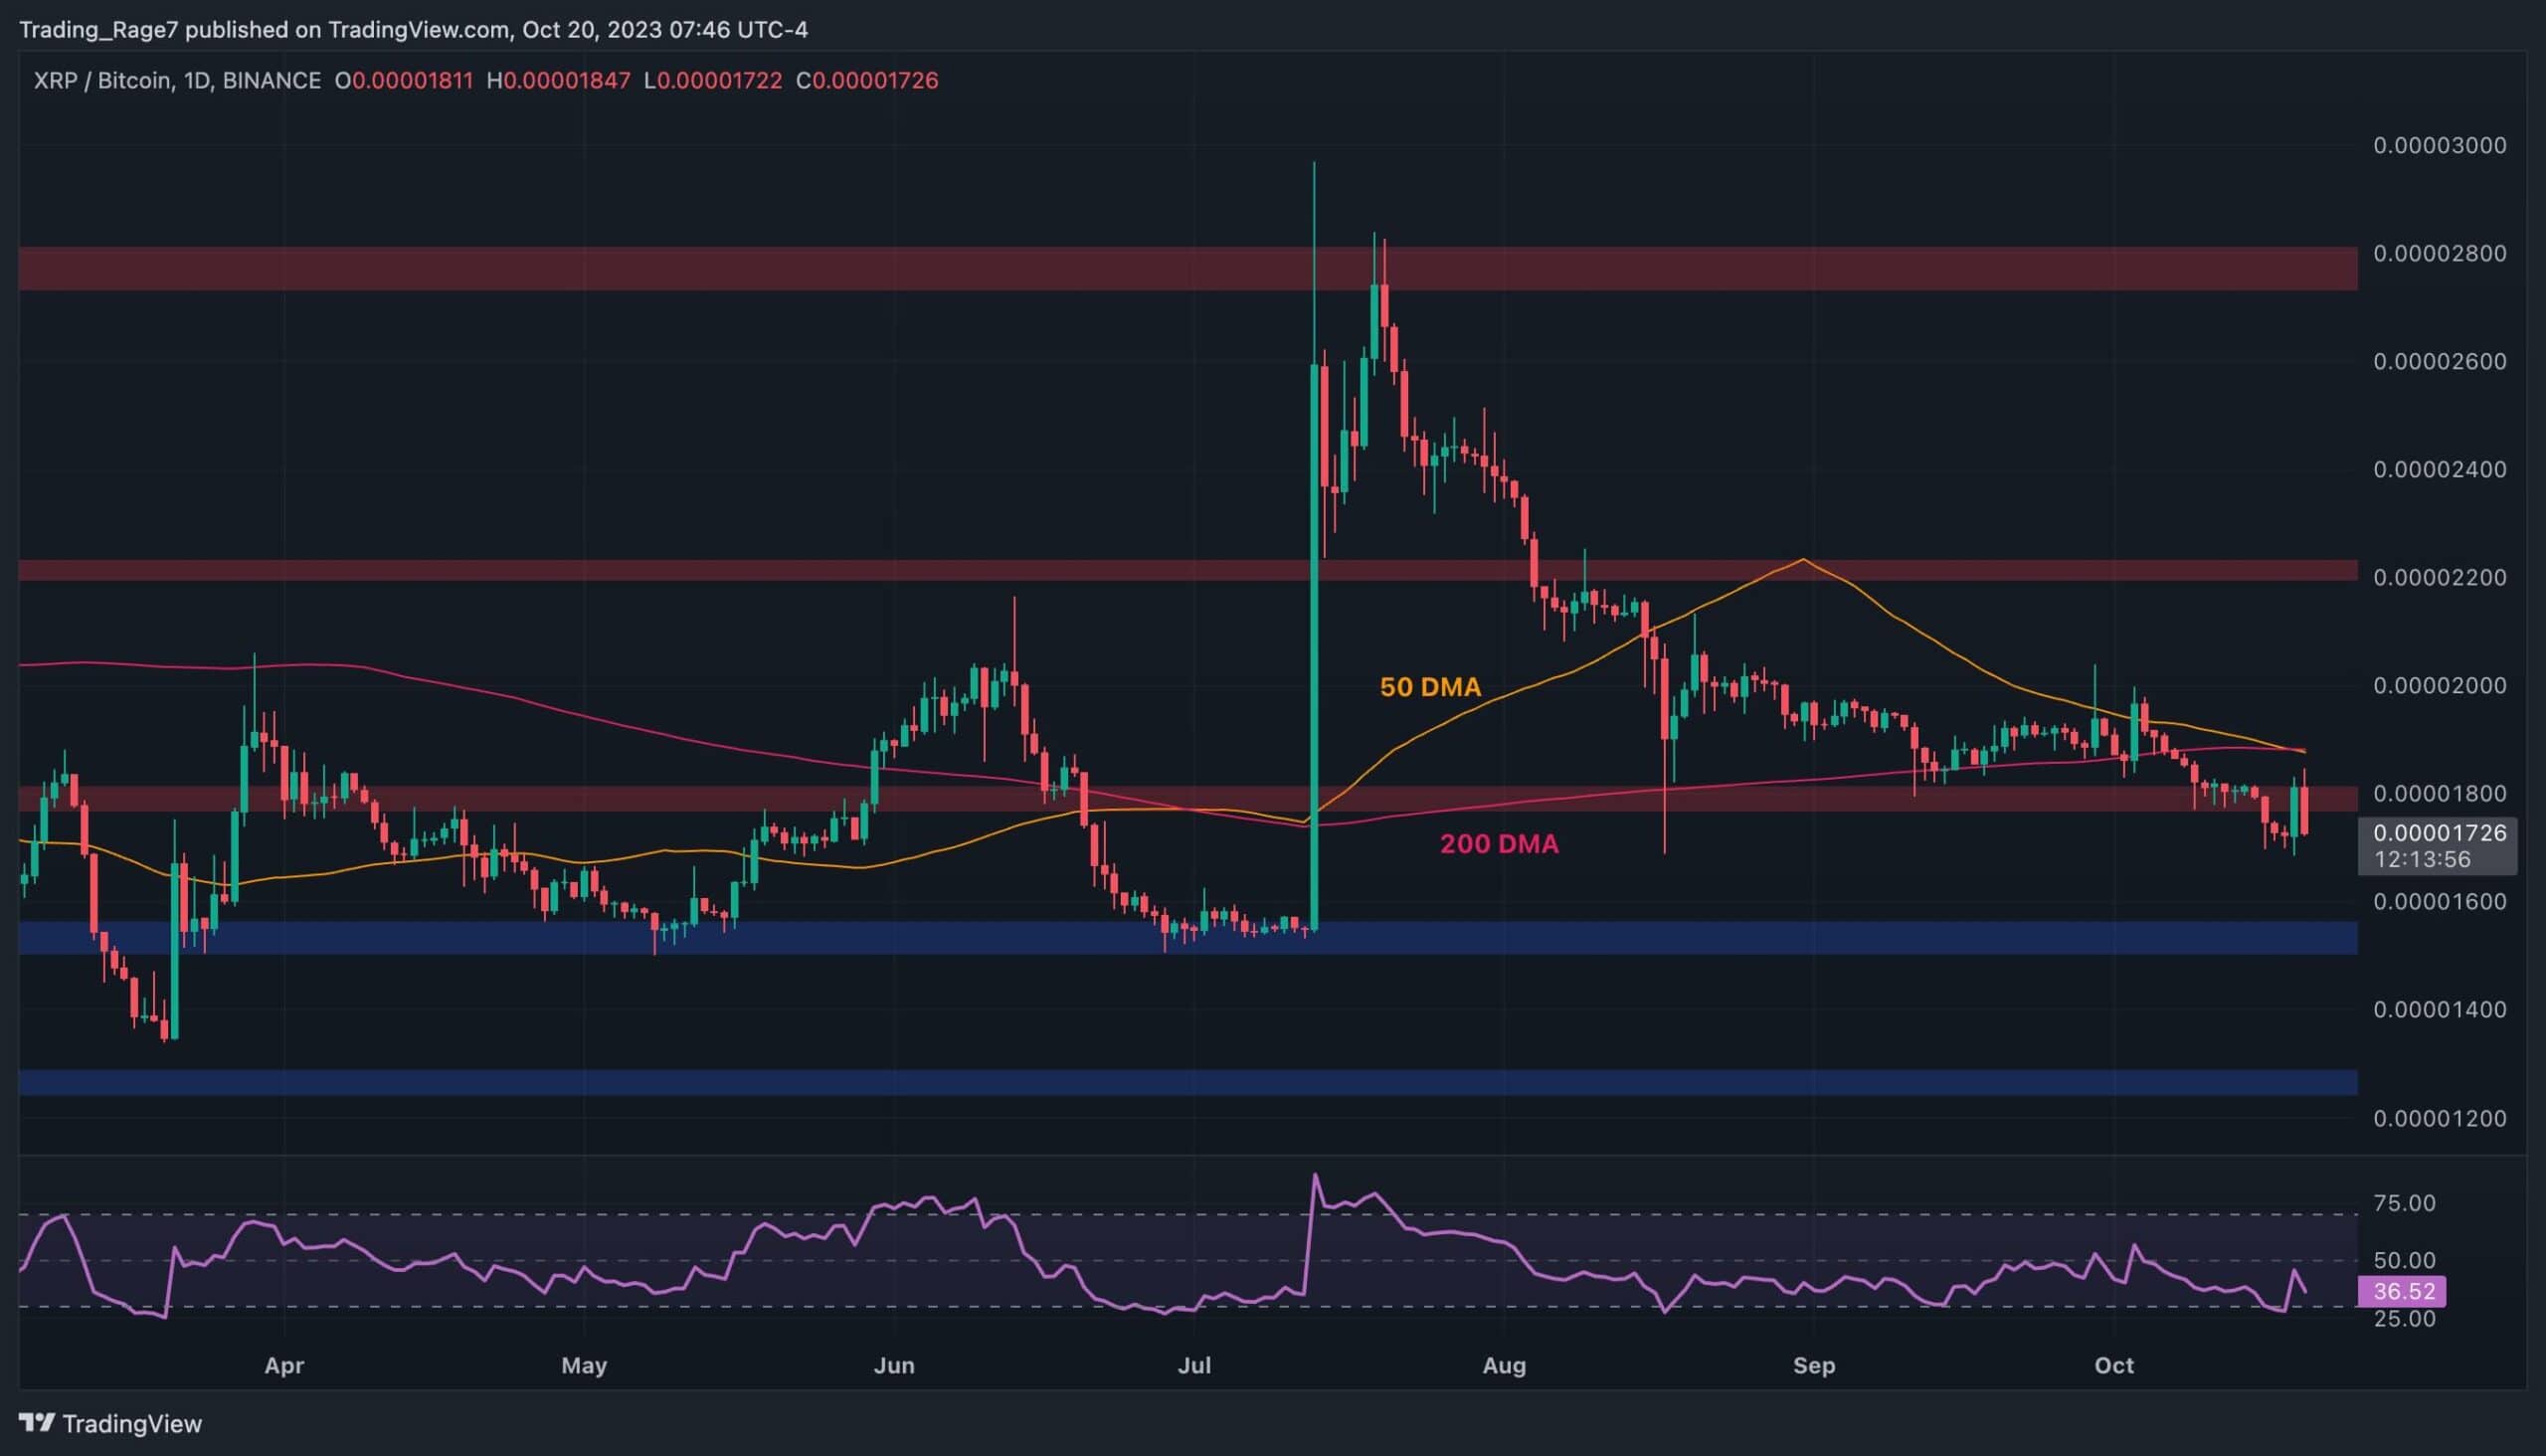
The BTC Paired Chart
Against BTC, things are looking worse for XRP. The price has recently broken below the 1800 SAT level and has failed to climb back above as it is getting rejected to the downside.
Moreover, considering the bearish crossover between the 50-day and 200-day moving averages, the market is likely to drop even lower toward the 1600 SAT area in the next few weeks.
LIMITED OFFER 2024 for CryptoPotato readers at Bybit: Use this link to register and open a $500 BTC-USDT position on Bybit Exchange for free!
Disclaimer: Information found on CryptoPotato is those of writers quoted. It does not represent the opinions of CryptoPotato on whether to buy, sell, or hold any investments. You are advised to conduct your own research before making any investment decisions. Use provided information at your own risk. See Disclaimer for more information.
Cryptocurrency charts by TradingView.


