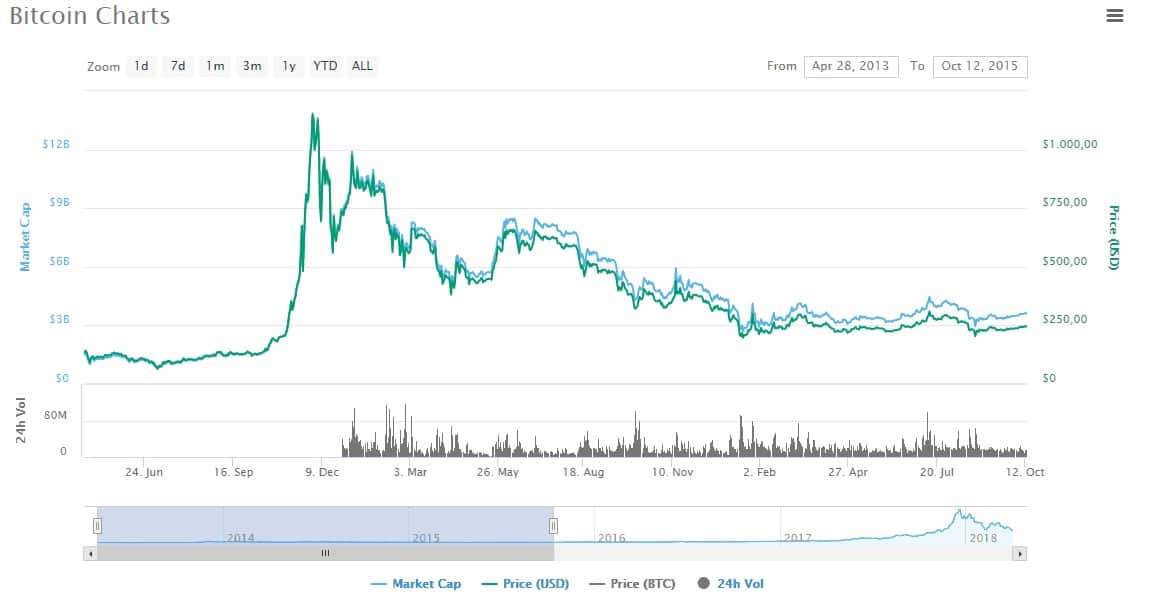
Bitcoin’s price on October 16th, 2013: $150. On November 30th, 2013: $1,150, and on December 19th, 2013: $560. What Was That All About?
Well, those who were around back then surely remember the massive Bitcoin run towards the end of 2013, or as it is more commonly referred to – “The 2013 Bitcoin Bubble.” We’re not necessarily calling it a bubble, although that was the consensus – it indeed had a lot to do with market cycles.
After 2013, bitcoin’s price dropped in what seemed to be a multi-month bear market. For almost two years, the market went into a prolonged consolidation, as well as a capitulation in a downtrend – until October 2015. That month is believed to be the turning point – the beginning of the 2017 bull-cycle.
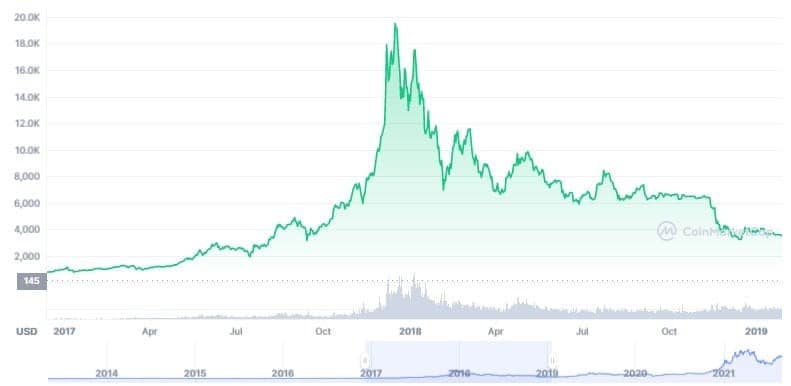
Bitcoin price slowly overcame the $300-400 consolidation which lasted for over two years. It spiked to the $500-600 price region in the middle of 2016, and from there, it was pretty much ‘up only’ – until reaching almost $20,000 – the peak achieved in December 2017.
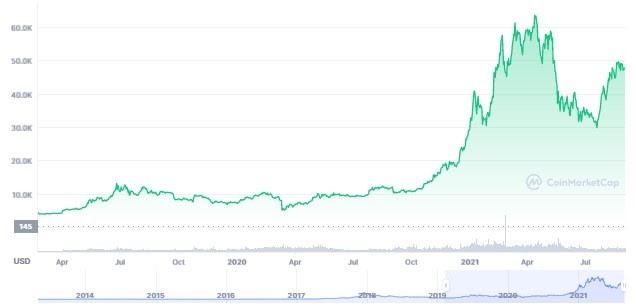
After that, though, the price started to decline, and it entered a prolonged bear market which arguably ended with the capitulation in December 2018, when Bitcoin recorded a price in the area around $3,200. Taking a closer look at the following chart, though, it definitely resembles the one from the aforementioned cycle:
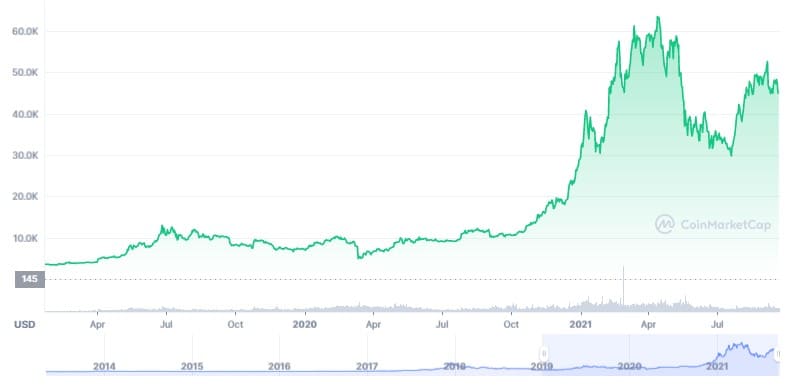
Fast forward to today’s market: Bitcoin went through a prolonged period of consolidation with a rally up to $14K in 2019 and then a subsequent retracement below $4K during the infamous COVID crash in March 2020 – which was an unusual event – a worldwide pandemic that was followed by the famous cascading liquidation event, which caused exchanges such as BitMEX to halt trading.
Ever since then, though, it was ‘up only’ for the cryptocurrency, and it saw an astonishing bull market that took its price all the way up to almost $65,000 in April 2021.
After reaching the peak, which is the current Bitcoin ATH, the bitcoin price retraced by over 50% to slightly below $30K and is now once again on its way to recovery (as of writing these lines).
Following the recent price action, as described above, there is an ongoing argument if what we currently witness is a cycle a-la-2013, which means the peak of the run will be in the coming months, or whether $65k was its peak and top.
All this begs one serious question that we attempt to answer in the current long-form.
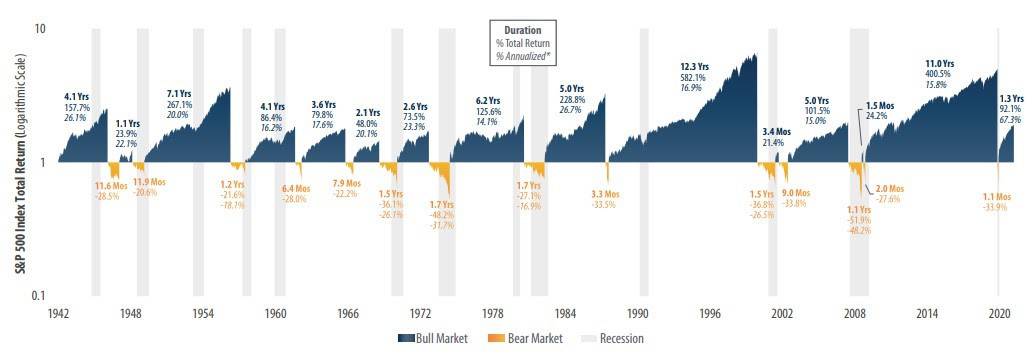
Market cycles are not only common for Bitcoin. In traditional markets, we are referring to the period between two highs or lows of a market. In the conservative stock market, such cycles happen over longer terms (years) on average. The image below shows the cycles of the US stock exchange throughout history, starting from the Great Depression in 1929.
The last famous recent lows of the cycles were around the years 2000, 2008, and 2020. They became known as the dot-com bubble pop, the sub-prime real estate crash, and the COVID19 financial crisis.
Unlike the first two, following the COVID crash in 2020, it took just a few weeks for Wall Street to get back onto a bullish track. NASDAQ charted a new all-time high just several months following the 30%+ corona crash.
As it can clearly be seen, the saying that “markets take the stairs up and the elevator down” is true for any other financial market and is true, especially for cryptocurrencies.
The major differentiating factor with crypto, however, is volatility. While a sharp daily movement of NASDAQ is considered to be 1-2%, Bitcoin, which is considered the most stable cryptocurrency and the base asset, can fluctuate more than 20% daily.
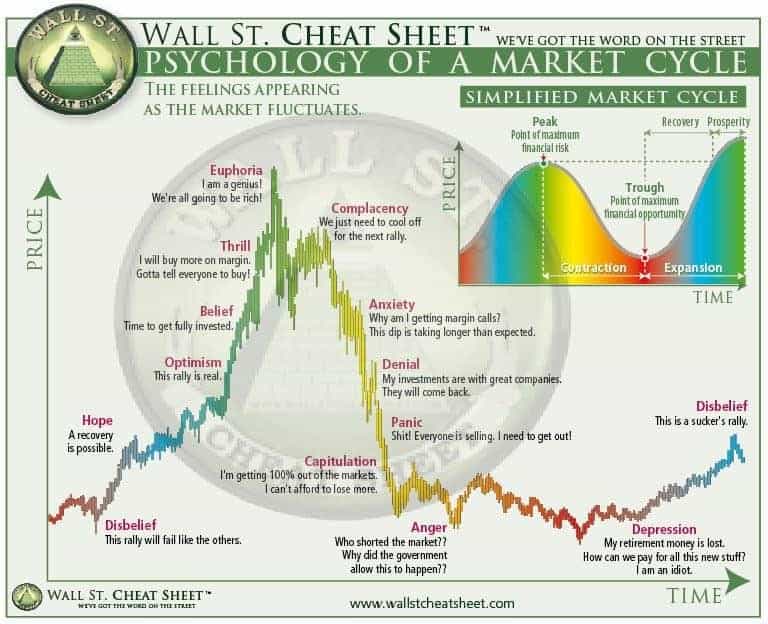
Karen Bennett, a writer at CheatSheet, created the following chart, showing the psychology of a market cycle. It describes the most common emotions investors experience as the market fluctuates. These human emotions drive our financial markets much more than the fundamentals.
These 10 stages repeat over time and define a market cycle. Not every market cycle will follow this exact chart and the exact time it takes.
However, it should give some valuable insights into the psychology of market cycles. All markets go through these stages over the short term. The duration and amplitude of these cycles are partially defined by risk (which is very high for the crypto market). Keep in mind – market cycles are hard to predict.
What we can take away from this is that markets don’t go up indefinitely, but they also don’t fall to zero (assuming they’re legitimate over the long-term). In the past, they’ve always “reverted to the mean.”
‘Hope’ is the first sign of recovery after “the serious disbelief” stage (see Stage 10 – last in the cycle). The market is showing positive signals for a new bull run. However, investors are still cautious. Small amounts of money are being invested.
Optimism defines the second stage where prices are rising as new capital flows in. This stage is reached when the market has been in a sustained uptrend for many months. The market has a positive outlook, and therefore many investors are comfortable investing money at this point.
As time goes by, optimism turns into belief. This stage of ‘belief’ is defined as one of the first signs of a bull market. Investors seek new opportunities in the market.
Searching for alternative investment options can be a good idea if you know what you are doing. People easily get caught up in feeling thrilled as they select random projects because they believe nothing can go wrong. Everything is running up.
It is important to keep track of your excitement level, as being overexcited is a clear sign for closing a position.
The end of a huge run-up is defined by euphoria. Human emotions are taking over, nothing can stop us now, it’s all rainbows and sunshine. There is only one direction – up. In this phase of the bull run, the “dumb money” jumps on board, and it’s usually the first to leave. At this stage, expect the press to write about the bull market, and you get the “meet the new young millionaires” articles. However, during this time, the smart money is taking profit throughout the parabolic movement.
At this stage, the bull run is stagnating as people’s lofty expectations are not met. The first signs of a reversing market start to pop up. This is a very dangerous time as people think the complacency stage is just a short break before the bull run continues. Many investors are ill-prepared for the upcoming market reversal.
Finally, people become aware that this bull run can’t go on forever. They see the market is reversing, losing value and money. The fear of losing lets traders delay the realization of a loss, which then turns into much greater losses.
The value of your investments continues to drop, and many people refuse to sell, hoping for an even bigger correction upwards. Investors act defensively as they are convinced they have allocated their money wisely. However, generally, almost no coin is able to come out scot-free. When there is rain, everyone gets wet.
The market continues to decline as the bear market has become a new reality. Investors try to save their funds by desperately selling their investments, as they are afraid to lose everything. Often we see a major sell-off happening at the panic stage.
People lose all hope and their belief in the existing market conditions. The market is at its lowest point in the current cycle (as will be noticed afterward). This is where stabilization and consolidation start building again. This stage can take a very long time.
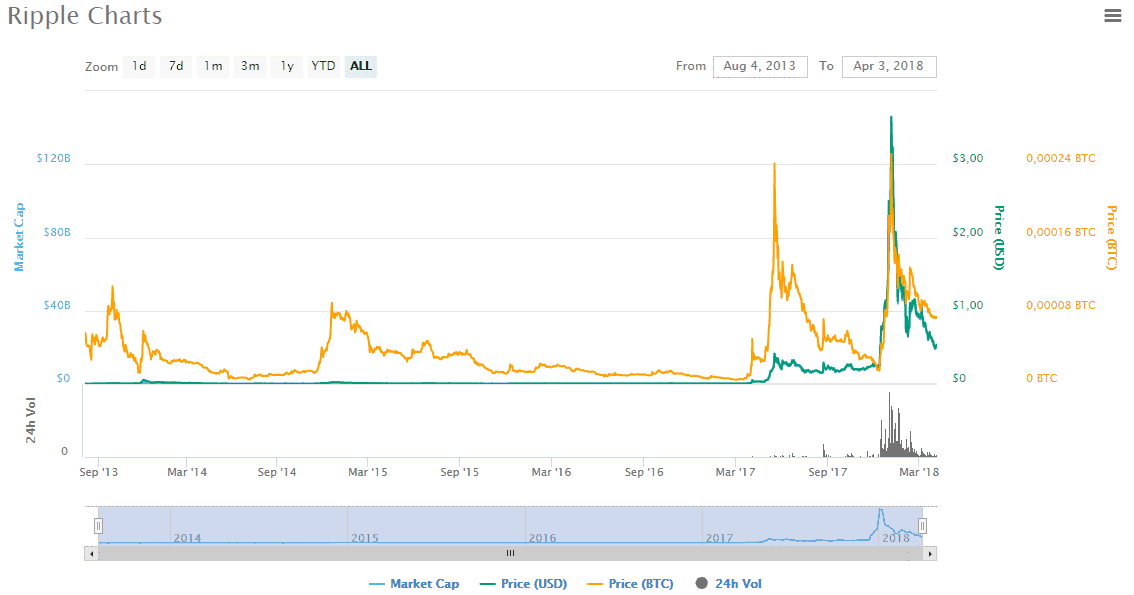
Bitcoin is not the only cryptocurrency that follows certain market cycles. Take a look at the following Ripple chart. You can spot two large market cycles and two smaller cycles. This is just part of the “Altcoins season.”
This is just one example. We can witness such market cycles in most large-cap altcoins, including Ethereum (ETH), Litecoin (LTC) and Dogecoin (DOGE).
Source: CoinMarketCap
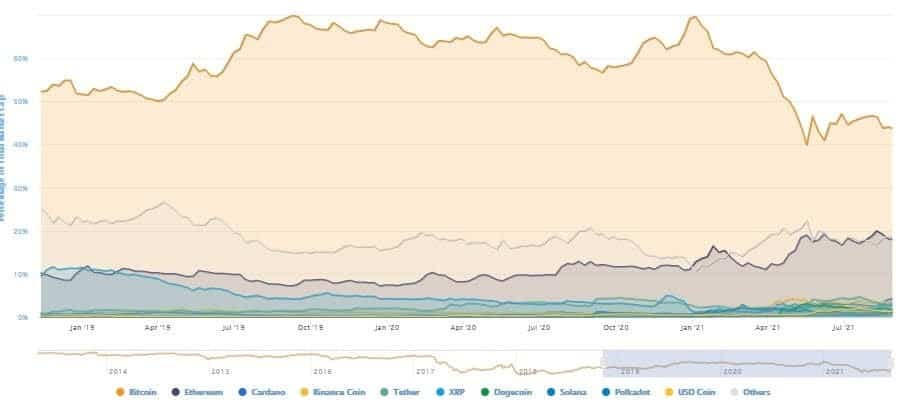
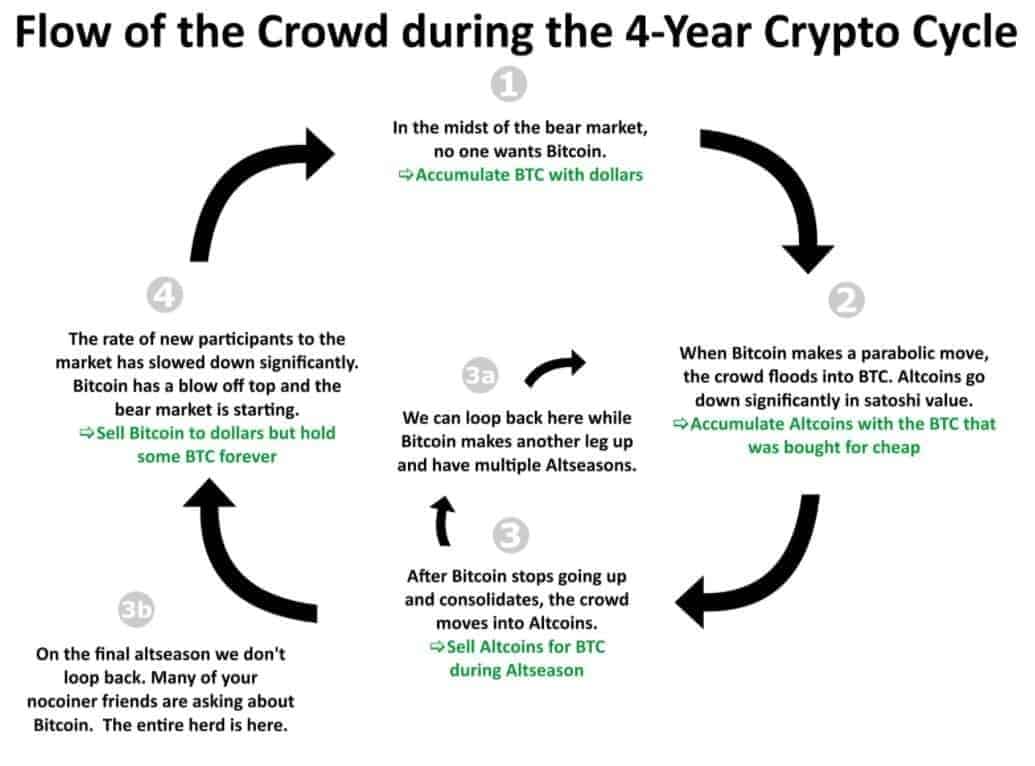
There are two major trends we generally see in a crypto market cycle:
New FIAT money flows into the crypto markets. Being the first and primary cryptocurrency, most of this money goes directly into Bitcoin as this is the entry point to the cryptocurrency markets .
Judging by the current market cycle (2021), The dominance of Bitcoin started to decline from April 2021 as many investors were looking for new altcoin investments.
This surge of altcoin buying is sometimes an indicator that a market is overbought as investors seek new opportunities, and so potentially indicates the next stage of the ongoing market cycle. Let’s take the 2017 cycle as an example: while Bitcoin peaked on December 2017, the “altcoin season” took place on January 2018.
The below is very well summarized by the prominent cryptocurrency analyst SecretsOfCrypto. He outlined the flow of the crowd during a 4-year crypto cycle in this graphic:
Following the above CheatSheet 10 stages chart, the phase of optimism/belief can be seen as the optimal entry point of a new bull market.
“Be fearful when others are greedy and greedy when others are fearful.” said legendary investor Warren Buffett.
In other words, when the market is in a state of disbelief and depression, it might be a good time to consider building up a position, keeping in mind you invest for the long-term and the market might continue declining over the short-term.
On the other hand, when the market enters the stage of overconfidence and euphoria, it might be time to consider realizing profit.
Watch out, because market cycles do not always exactly follow this pattern. In some extreme situations. It is entirely possible that you enter into a prolonged bear market where further losses are on the horizon. The other is also true – extreme euphoria can send the market even higher, blowing off the current peaks and skyrocketing even higher.
To avoid getting caught in this whirlwind, always practice meticulous risk management. When it comes to cryptocurrency trading, we’ve prepared a list of 15 crypto trading tips that you can take a look at to optimize your process.