

- Tezos dropped to $2.73 following Bitcoin’s dump yesterday.
- Despite that, the bullish trajectory is still much valid across trading pairs but the price remains indecisive.
- The price should bounce back if Bitcoin can hold the $9500 level as support.
XTZ/USD: Tezos Returns Gains After Faking out
Key Resistance Levels: $3.14, $3.3, $3.95
Key Support Levels: $2.73, $2.37, $2.06
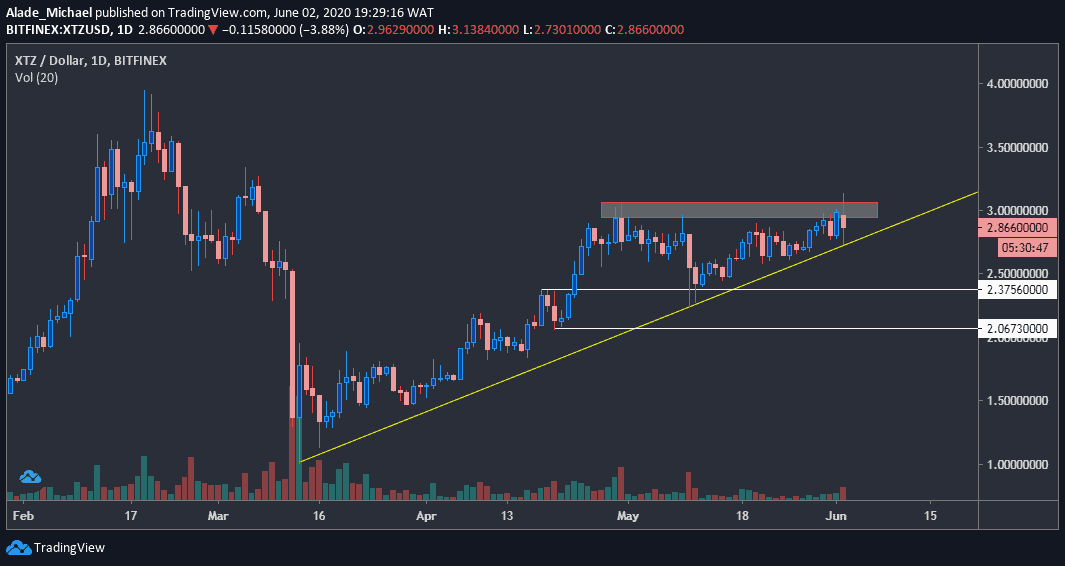
After a long period of consolidation, Tezos saw a quick 6% surge to reach a three-month high of $3.15 yesterday. But all of this was quickly turned into a 1.5% loss in just 15-minutes following the latest dump in Bitcoin’s price over the last 24-hours.
Due to move, Tezos is now roaming around $2.87 after losing the $3 key level. The price could bounce back if Bitcoin can hold the $9500 level as support. However, it may become difficult for XTZ to regain momentum if the buyers fail to regroup back above the important $3 level.
Meanwhile, the bullish trajectory is still much valid as long as the yellow trend line continues to hold.
Tezos Price Analysis
It would be too early to start thinking of a drop, although the price recovery over the past months is quite noticeable on the daily chart. However, a possible double top pattern could reverse the trend.
If the price drops below the weekly low of $2.73, the potential support to keep in mind is $2.35, followed by a key level at $2.06. $1.8 might also come into play if the pressure continues.
Reclaiming the $3 level would be a good start point for a fresh increase. It would still need to clear yesterday’s high of $3.15 before rising further to $3.3 and $3.94, which is the current yearly high.
Such actions can be expected as soon as trading volume evaporates back in the market. Despite that, XTZ remains bullish on a short-term perspective.
XTZ/BTC: Tezos Is Struggling Under 30000 SAT Level
Key Resistance Levels: 30000SAT, 38000 SAT, 40000 SAT
Key Support Levels: 28500 SAT, 25000 SAT, 24000 SAT

Against Bitcoin, Tezos is consolidating since it rebounded from a key level of 25000 SAT in May. The price has been facing key resistance at 30000 SAT level for some days now. The long-term bullish trend is still valid on the daily chart but it may remain indecisive if buyers fail to reiterate short-term actions.
Meanwhile, bears are also showing commitment to trading following previous lower highs (marked as resistance) at the 40000 SAT and 38000 SAT levels. A new lower high might come around 35000 SAT if Tezos fails to push further. As can be seen on the daily chart, it is currently forming a bullish triangle pattern.
Tezos Price Analysis
While consolidating around 30000 SAT, the potential resistance level to keep an eye on is at 35000 SAT, around the triangle’s resistance. A break above it should send price straight to 38000 SAT and the 40000 SAT resistance, which is currently holding as yearly high.
Tezos is holding weekly support on the grey-marked trend line at 28500 SAT, near the triangle’s support. The long-term bullish action might come to an end if the price drops below this triangle. The closest support to watch for such a move is 25000 SAT and $24000 SAT, as indicated white in the above chart.
Disclaimer: Information found on CryptoPotato is those of writers quoted. It does not represent the opinions of CryptoPotato on whether to buy, sell, or hold any investments. You are advised to conduct your own research before making any investment decisions. Use provided information at your own risk. See Disclaimer for more information.
Cryptocurrency charts by TradingView.


