CryptoPotato
CryptoPotato
  • Crypto News
  • Margin Trading
  • Guides
    • Bitcoin & Crypto Guides 101
    • Bitcoin For Beginners
    • Editorials
  • DeFi & NFT
  • Buy
  • Language
    • Spanish
    • Turkish
    • German
    • Bulgarian
  • Crypto News
  • Bitcoin For Beginners
  • Cryptocurrency Guides 101
  • Editorials
  • Bitcoin & Crypto Margin Trading
  • DeFi & NFT News
  • Bitcoin Price Analysis
  • Ethereum (ETH) Price Analysis
  • Ripple (XRP) Price Analysis
  • Market Updates
  • Interviews
  • Buy Bitcoin with Card
  • CryptoPotato Spanish
  • CryptoPotato Turkey
  • CryptoPotato Germany
  • CryptoPotato Bulgaria
  • Market Updates
  • BTC Analysis
  • ETH Analysis
  • XRP Analysis
  • Interviews
CryptoPotato
CryptoPotato
  • Crypto News
  • Margin Trading
  • Guides
    • Bitcoin & Crypto Guides 101
    • Bitcoin For Beginners
    • Editorials
  • DeFi & NFT
  • Buy
  • Language
    • Spanish
    • Turkish
    • German
    • Bulgarian
  • Crypto News
  • Bitcoin For Beginners
  • Cryptocurrency Guides 101
  • Editorials
  • Bitcoin & Crypto Margin Trading
  • DeFi & NFT News
  • Bitcoin Price Analysis
  • Ethereum (ETH) Price Analysis
  • Ripple (XRP) Price Analysis
  • Market Updates
  • Interviews
  • Buy Bitcoin with Card
  • CryptoPotato Spanish
  • CryptoPotato Turkey
  • CryptoPotato Germany
  • CryptoPotato Bulgaria
Home » Crypto News » Ethereum Price Analysis: ETH Plotting A Move At $135 But Triangle Pattern Still Holds, What’s Next?

Ethereum Price Analysis: ETH Plotting A Move At $135 But Triangle Pattern Still Holds, What’s Next?

Author: Michael Fasogbon

Last Updated Mar 25, 2020 @ 14:06
Getting your audio player ready...
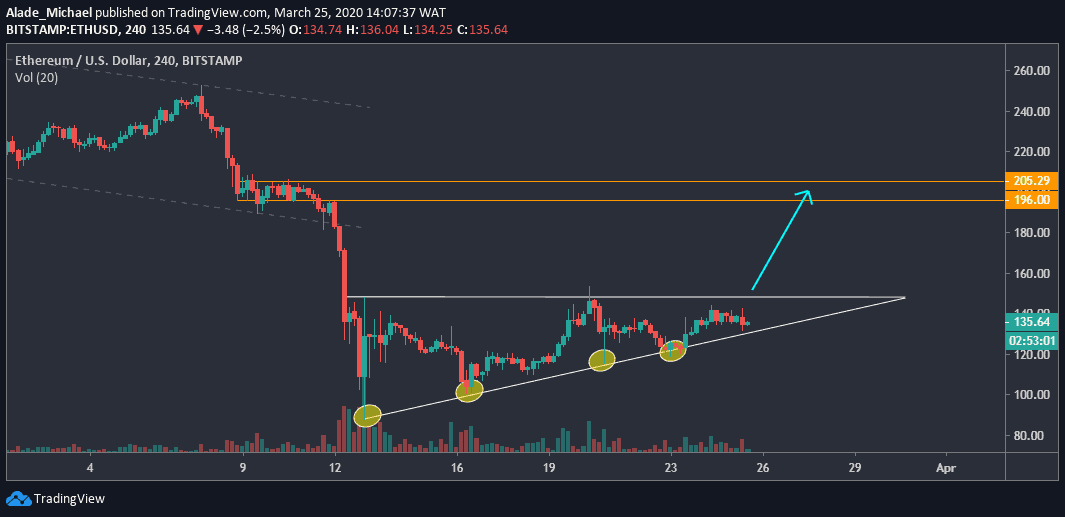
  • Following the latest price actions, Ethereum is undergoing consolidation around $135 against the US Dollar
  • Ethereum is primed for a massive gain, but the price is still captured in an ascending triangle pattern
  • After breaking long-term support, Ethereum continued to drop and now faces another five-month support at 0.0195 BTC level against Bitcoin.

ETH/USD: Ethereum Looking For Breakout

Key Resistance Levels: $160, $180, $196

Key Support Levels: $121, $101, $86

ethusd_chart
ETH/USD. Source: TradingView

This week, the cryptocurrency market continued to recover due to the increase in Bitcoin’s price and volumes, which have cumulatively brought the total market capitalization to $187.5 billion at the time of writing.

As a result, Ethereum, the second-largest cryptocurrency, has similarly seen substantial growth over the past days after rising from $86 – the monthly low.

Ether has further pushed a series of higher lows at $101, which was last week’s low and $121 (the weekly low). Along with these lows, circled yellow on the 4-hours time frame, Ethereum’s current high is leveled at $149, which technically forms an ascending triangle pattern.

Currently, the price has reached the apex of the triangle formation, which could suggest a potential breakout is underway.

Ethereum Price Analysis

Once a triangle breakup occurs, the significant price gains would be projected at the orange levels of $196 – $205, where Ether consolidated in early March.

Meanwhile, Ethereum is likely to encounter resistance at $153 (last week’s high), followed by $160 and $180 along the way.

On the other hand, if Ethereum turns bearish, a triangle breakdown may cause a serious drop to the previous support of $121. The next support after this is $101 and $86. A drive beneath this support could trigger a mid-term bearish continuation for Ethereum.

ETH/BTC: Ethereum Approaching 5-Month Support

Key Resistance Levels: 0.0225 BTC, 0.024 BTC

Key Support Levels: 0.0195 BTC, 0.0175 BTC

ethbtc_chart
ETH/BTC. Source: TradingView

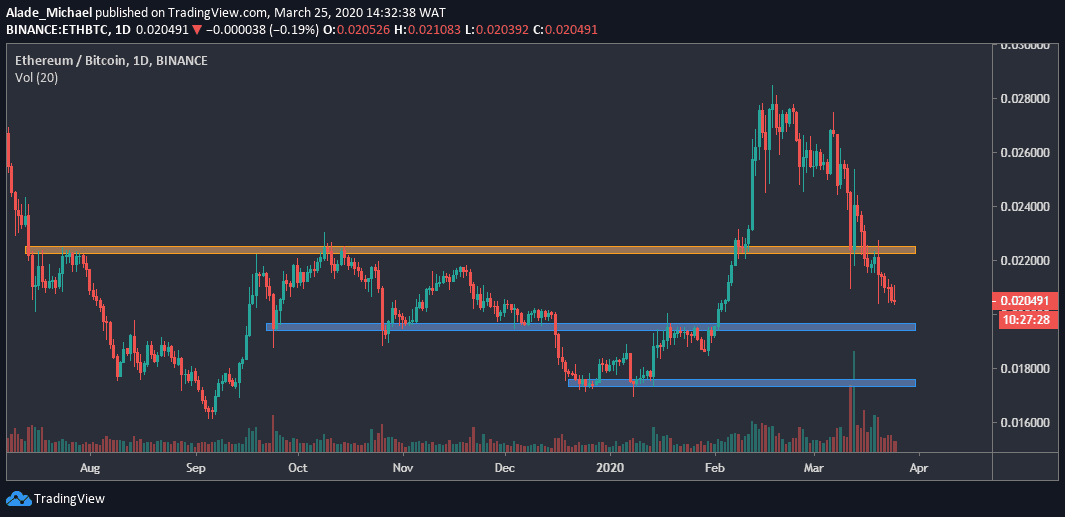
Against Bitcoin, Ethereum is still showing signs of weakness after losing almost 33% of its value in five weeks.

Following these drops, ETH broke beneath crucial support of 0.0225 BTC level on March 13 with further losses to where it’s currently priced at 0.020 BTC.

We can see that Ethereum’s volatility is quite low at the moment. It can be traced to the decreasing volume in the market.

However, as long as the price stays under the orange area of 0.022 BTC, Ethereum would remain in a downward spiral until buyers show strong interest. For now, the bearish trajectory is still valid on the daily chart.

Ethereum Price Analysis

Ethereum is currently approaching five-month support at 0.0195 BTC, which is the immediate blue demand area on the daily chart.

If ETH fails to rebound here, the price may collapse seriously to the second blue demand area of 0.0175 BTC – the December 2019 low.

But looking at the current price actions, it appeared that bears are reaching exhaustion point. If Ethereum can find nearby support and rebound back above the 0.0225 BTC resistance level, there’s hope for the bulls to reclaim the lost 0.028 BTC resistance. Notwithstanding, the 0.024 BTC level remains a close resistance for the buyers.

SPECIAL OFFER (Sponsored)
Binance Free $600 (CryptoPotato Exclusive): Use this link to register a new account and receive $600 exclusive welcome offer on Binance (full details).

LIMITED OFFER for CryptoPotato readers at Bybit: Use this link to register and open a $500 FREE position on any coin!


Disclaimer: Information found on CryptoPotato is those of writers quoted. It does not represent the opinions of CryptoPotato on whether to buy, sell, or hold any investments. You are advised to conduct your own research before making any investment decisions. Use provided information at your own risk. See Disclaimer for more information.

Cryptocurrency charts by TradingView.
Tags: Ethereum (ETH) Price
Enjoy reading? Share with your friends
Facebook Twitter LinkedIn Telegram

About The Author

Michael Fasogbon
More posts by this author

Michael is a professional trader and cryptocurrency technical analyst with many years of trading experience. He became passionate about cryptocurrencies and blockchain technology through his sister and has since been following the industry

Join Our Community

FacebookX YouTubeTelegram


Editorials
10 Best Meme Coins to Watch in June 2025

10 Best Meme Coins to Watch in June 2025

7 Best Meme Coin Presales to Watch in June 2025

7 Best Meme Coin Presales to Watch in June 2025

Toobit Review 2025: Is Toobit a Safe Crypto Exchange?

Toobit Review 2025: Is Toobit a Safe Crypto Exchange?

Hyperliquid Bridge: How to Bridge USDC to Hyperliquid

Hyperliquid Bridge: How to Bridge USDC to Hyperliquid

11 Best Crypto Presales to Consider in June 2025

11 Best Crypto Presales to Consider in June 2025

Need for Speed – Only Ultra-Fast Blockchains Will Win the Adoption Race (Opinion)

Need for Speed – Only Ultra-Fast Blockchains Will Win the Adoption Race (Opinion)

The 5 Best Bitcoin Mining Pools in 2025: Complete Guide

The 5 Best Bitcoin Mining Pools in 2025: Complete Guide

Join Our Newsletter
Become a CryptoPotato VIP
One Weekly Email Can Change Your Crypto Life.
Sign-up FREE to receive our extended weekly market update and coin analysis report
We NEVER send spam. You can unsubscribe at any time.
Invalid email address
Thanks for subscribing!
Footer Logo
About
Advertise on CryptoPotato
About Us | Contact Us | Careers
Editorial Policy
Terms of service | Privacy Policy | GDPR
More Sections
IEO List | Evaluations
Airdrops
Scholarship
Disclaimer
Disclaimer: Information found on CryptoPotato is those of writers quoted. It does not represent the opinions of CryptoPotato on whether to buy, sell, or hold any investments. You are advised to conduct your own research before making any investment decisions. Use provided information at your own risk. Full disclaimer
© Copyright CryptoPotato 2016 - 2025
Scroll to top
One Daily Email Can Change Your Crypto Life.

Sign-up FREE to receive our extended daily market update and coin analysis report

We never send SPAM. You can unsubscribe at any moment
Invalid email address
Thanks for subscribing!