The cryptocurrency market has undergone a major shift over the past 24 hours as Bitcoin briefly dropped below the $10,000 level. Ethereum wasn’t left out of the crosshairs, as it marked a decrease of 6%, lowering its price to $225. Furthermore, ETH has continued to slide against BTC, creating fresh multi-year lows.
Nevertheless, it remains the second-largest cryptocurrency by market value with a market cap of $24.10 billion. ETH has now lost a total of 27% over the past 7 days, and the cryptocurrency currently trades around the 200-day EMA support level.
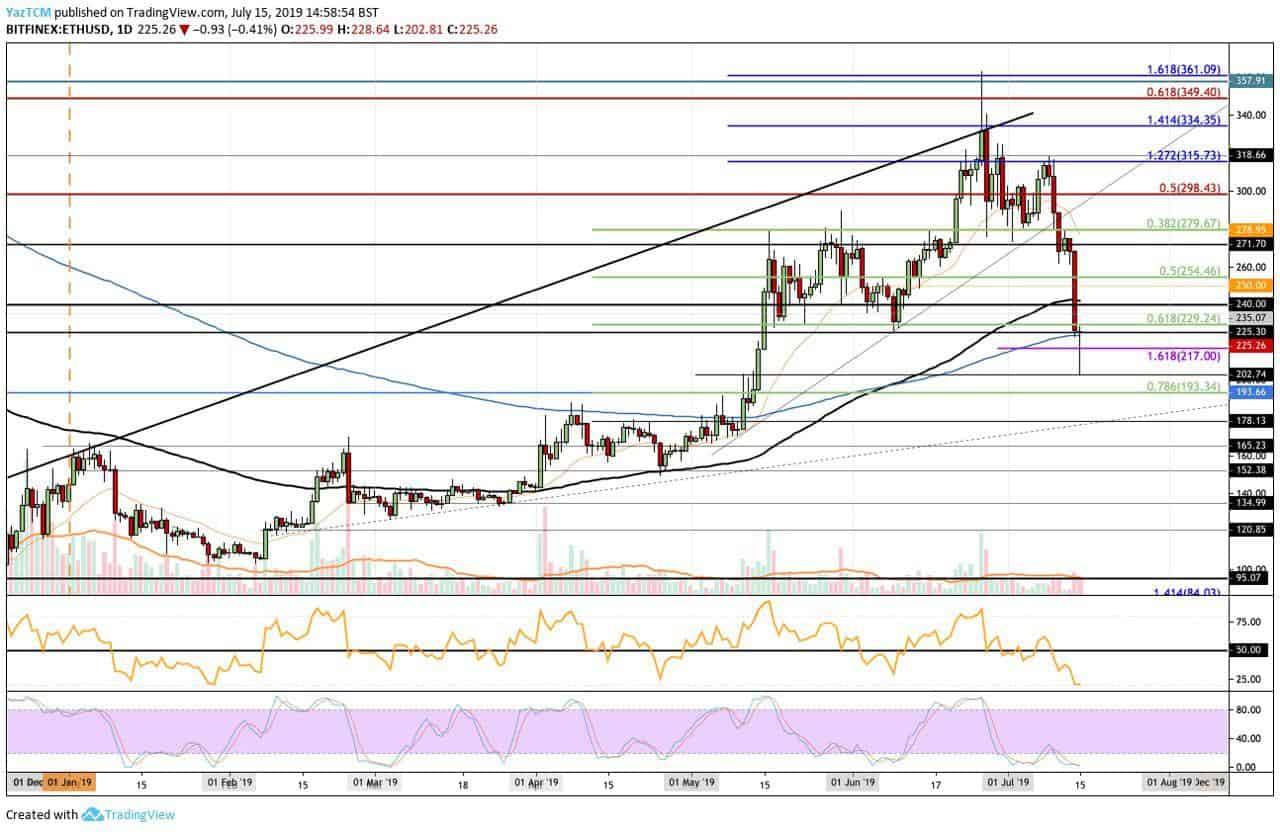
Looking at the ETH/USD 1-day chart:
- Since our previous ETH/USD analysis, Ethereum fell beneath the support at $270. It then dropped below the support at $254 and $240 to reach the support at $225 provided by the 200-day EMA. At one point ETH even dropped as low as $202 but has since rebounded.
- From above: The nearest levels of resistance lie at $230 and $240. The resistance at $240 is bolstered by the 100-day EMA. If the bulls push the price above $250, higher resistance lies at $254, $271, $279, and $300.
- From below: The nearest level of support is located at the current price of $225. Beneath this, further support lies at $217, $202, and $200. If the selling continues beneath the $200 level, the next levels of support lie at $193 and $178.
- The trading volume remains at about the average level during the recent round of selling.
- The RSI recently nosedived below the 50 level as the sellers took full control. For it to recover, we will need to see the RSI rise back above 50.
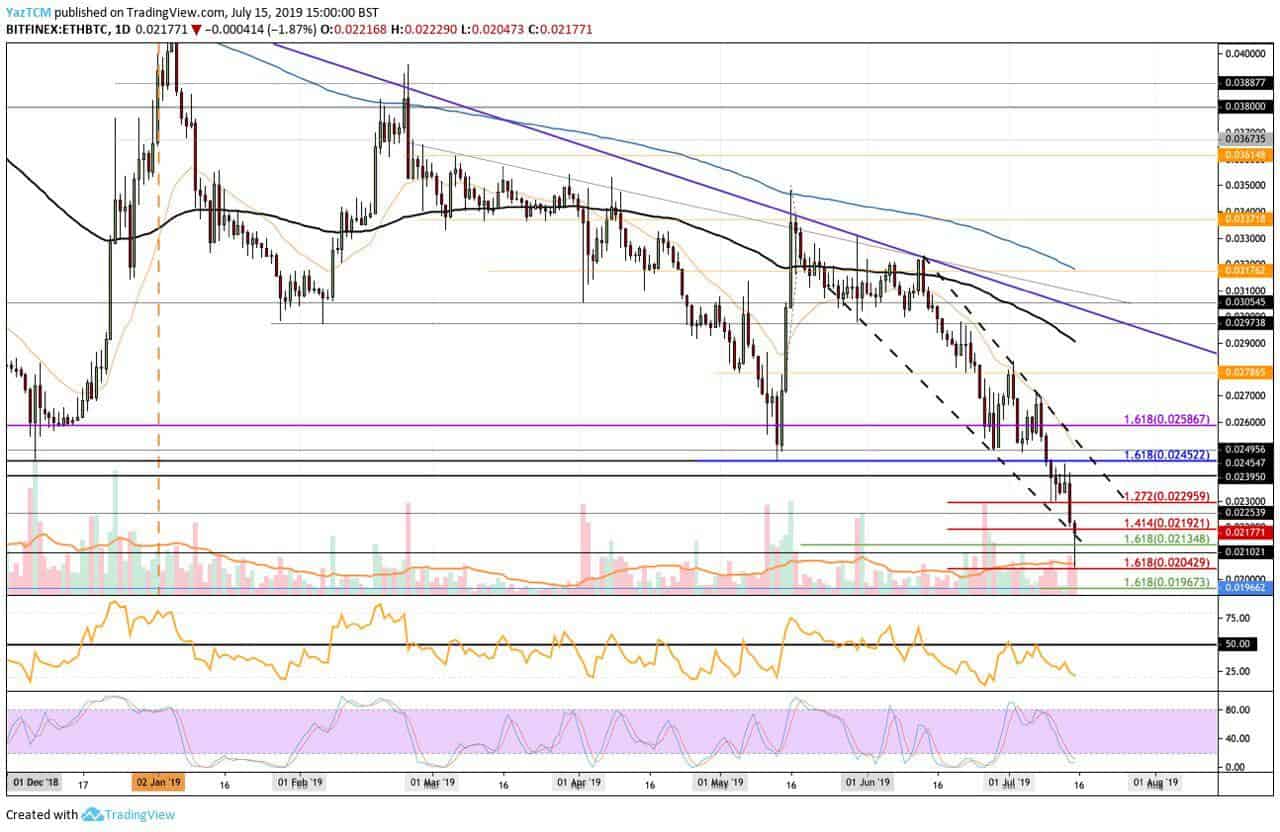
Looking at the ETH/BTC 1-day chart:
- Against Bitcoin, ETH collapsed below the support at 0.023 BTC and continued much lower. The ETH/BTC market has found support around the 0.0217 BTC level, but the market dropped to as low as 0.02042 BTC during the selling today.
- From above: The nearest level of resistance lies at 0.022 BTC. Above this, higher resistance lies at 0.0225 BTC, 0.023 BTC, 0.02395 BTC, and 0.024522 BTC.
- From below: The nearest level of support lies at 0.02134 BTC. Beneath this, further support is located at 0.021 BTC and 0.02042 BTC. If the sellers continue beneath 0.02 BTC, the next level of support lies at 0.01967 BTC.
- The trading volume has spiked above average during the recent selling stampede.
- The RSI is also well below the 50 level in this market as the bears have held control. The Stochastic RSI is also in oversold territory as we wait for a bullish crossover to signal that the market is ready to move higher.
SPECIAL OFFER (Sponsored)
Binance Free $600 (CryptoPotato Exclusive): Use this link to register new account and receive $600 exclusive welcome offer on Binance (
full details).
LIMITED OFFER 2024 for CryptoPotato readers at Bybit: Use this link to register and open a $500 BTC-USDT position on Bybit Exchange for free!
Disclaimer: Information found on CryptoPotato is those of writers quoted. It does not represent the opinions of CryptoPotato on whether to buy, sell, or hold any investments. You are advised to conduct your own research before making any investment decisions. Use provided information at your own risk. See Disclaimer for more information.
Cryptocurrency charts by TradingView.