

Ethereum recently dropped beneath a long-term support trend line as the cryptocurrency fell 7.24% over the past week to $268.83. The price drop comes after Ethereum created fresh multi-year lows against Bitcoin at 0.023 BTC.
Ethereum remains the second-largest cryptocurrency by market value, with a market cap of $28.91 billion. The cryptocurrency’s price is still up by 61% over the past 3 months. However, if Ethereum does not show any signs of recovery against BTC, we could see ETH/USD fall further toward $200.
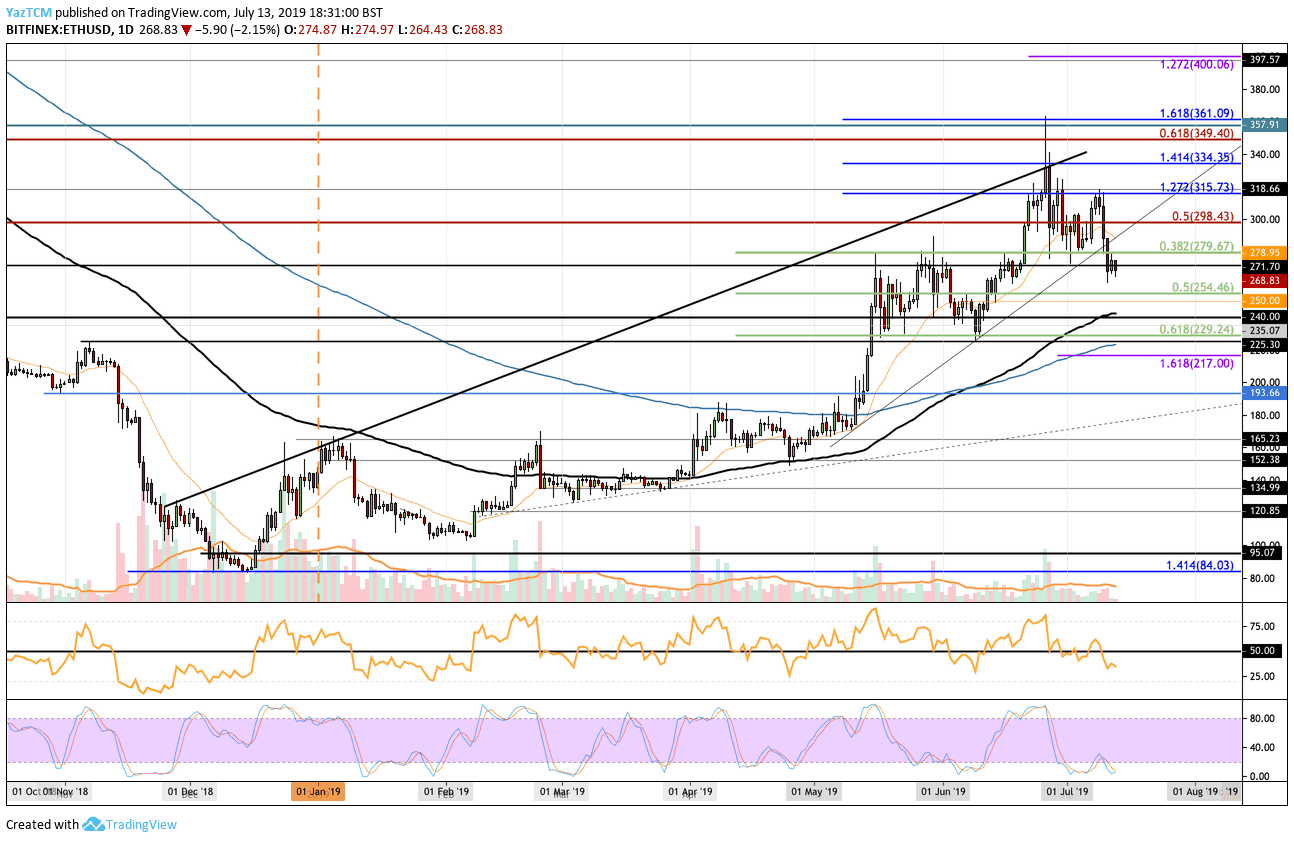
Looking at the ETH/USD 1-day chart:
- Since our previous ETH/USD analysis, Ethereum has fallen beneath the 2-month-old rising trend line to support at the $270 level. This marks a significant break in the trend as we wait to see if ETH/USD will consolidate or continue lower.
- From above: The nearest levels of resistance lie at $280 and $300. If the buyers break above the $300 level, further resistance lies at $315, $334 and $350.
- From below: If the selling continues beneath $265, the next level of support lies at $254, which is provided by the short-term .5 Fibonacci retracement level. Beneath this, further support lies at $250 and $240 (which also contains the 100-day EMA). Support below $240 is located at $229 (short term .618 Fib retracement) and $225 (200-day EMA).
- The trading volume remains very low relative to the rest of the year.
- The RSI slipped below the 50 level, which shows that the bears are in control of the market.
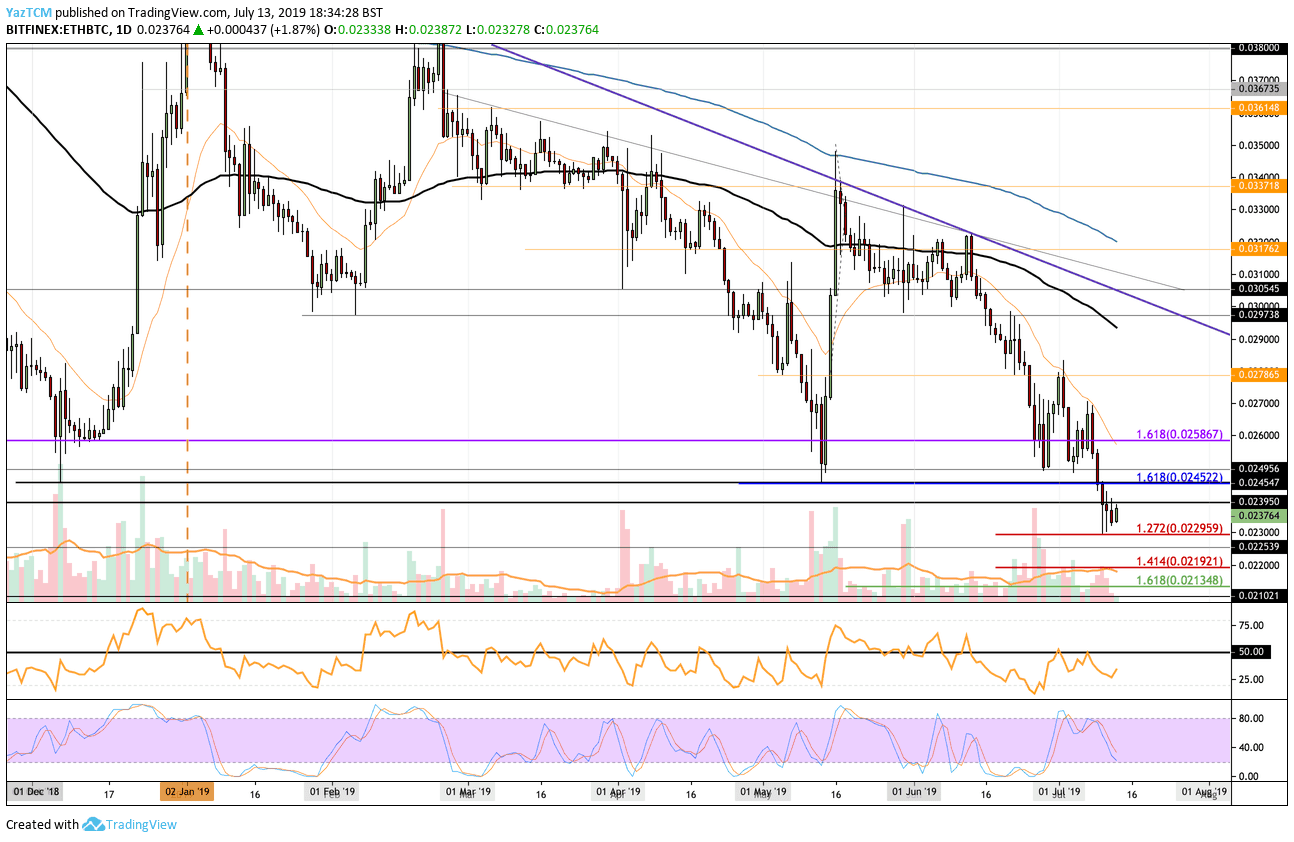
Looking at the ETH/BTC 1-day chart:
- The ETH/BTC market has stabilized somewhat at the 0.023 BTC level after breaking through major long-term support around 0.0245 BTC. ETH/BTC is currently trading at 0.02376 BTC as it looks for a small bounce.
- From above: The nearest level of resistance lies at 0.024 BTC. Above this, higher resistance lies at 0.0245 BTC, 0.025 BTC and 0.026 BTC. The resistance at 0.026 BTC is further bolstered by the 20-day EMA.
- From below: The nearest level of support now lies at 0.023 BTC. If the sellers push beneath here, further support lies at 0.0225 BTC, 0.022 BTC and 0.02192 BTC.
- The trading volume remains close to the average for 2019.
- The RSI has started to rise toward the 50 level, which is a sign that the selling pressure may be diminishing. However, we will need to see the RSI break above 50 to see any form of recovery.
Disclaimer: Information found on CryptoPotato is those of writers quoted. It does not represent the opinions of CryptoPotato on whether to buy, sell, or hold any investments. You are advised to conduct your own research before making any investment decisions. Use provided information at your own risk. See Disclaimer for more information.
Cryptocurrency charts by TradingView.


