

- Ethereum dropped by a total of 9% over the past week as it breaks beneath $400, currently marking $380 – $382 as a critical defensive wall before a further downside price action.
- Despite this price decline, Ethereum remains mid-term bullish within the August trading range of $438 and $363.
- Against Bitcoin, Ethereum penetrated beneath the March 2019 support as it trades at 0.0334 BTC.
ETH/USD – The Fight to Reclaim $400
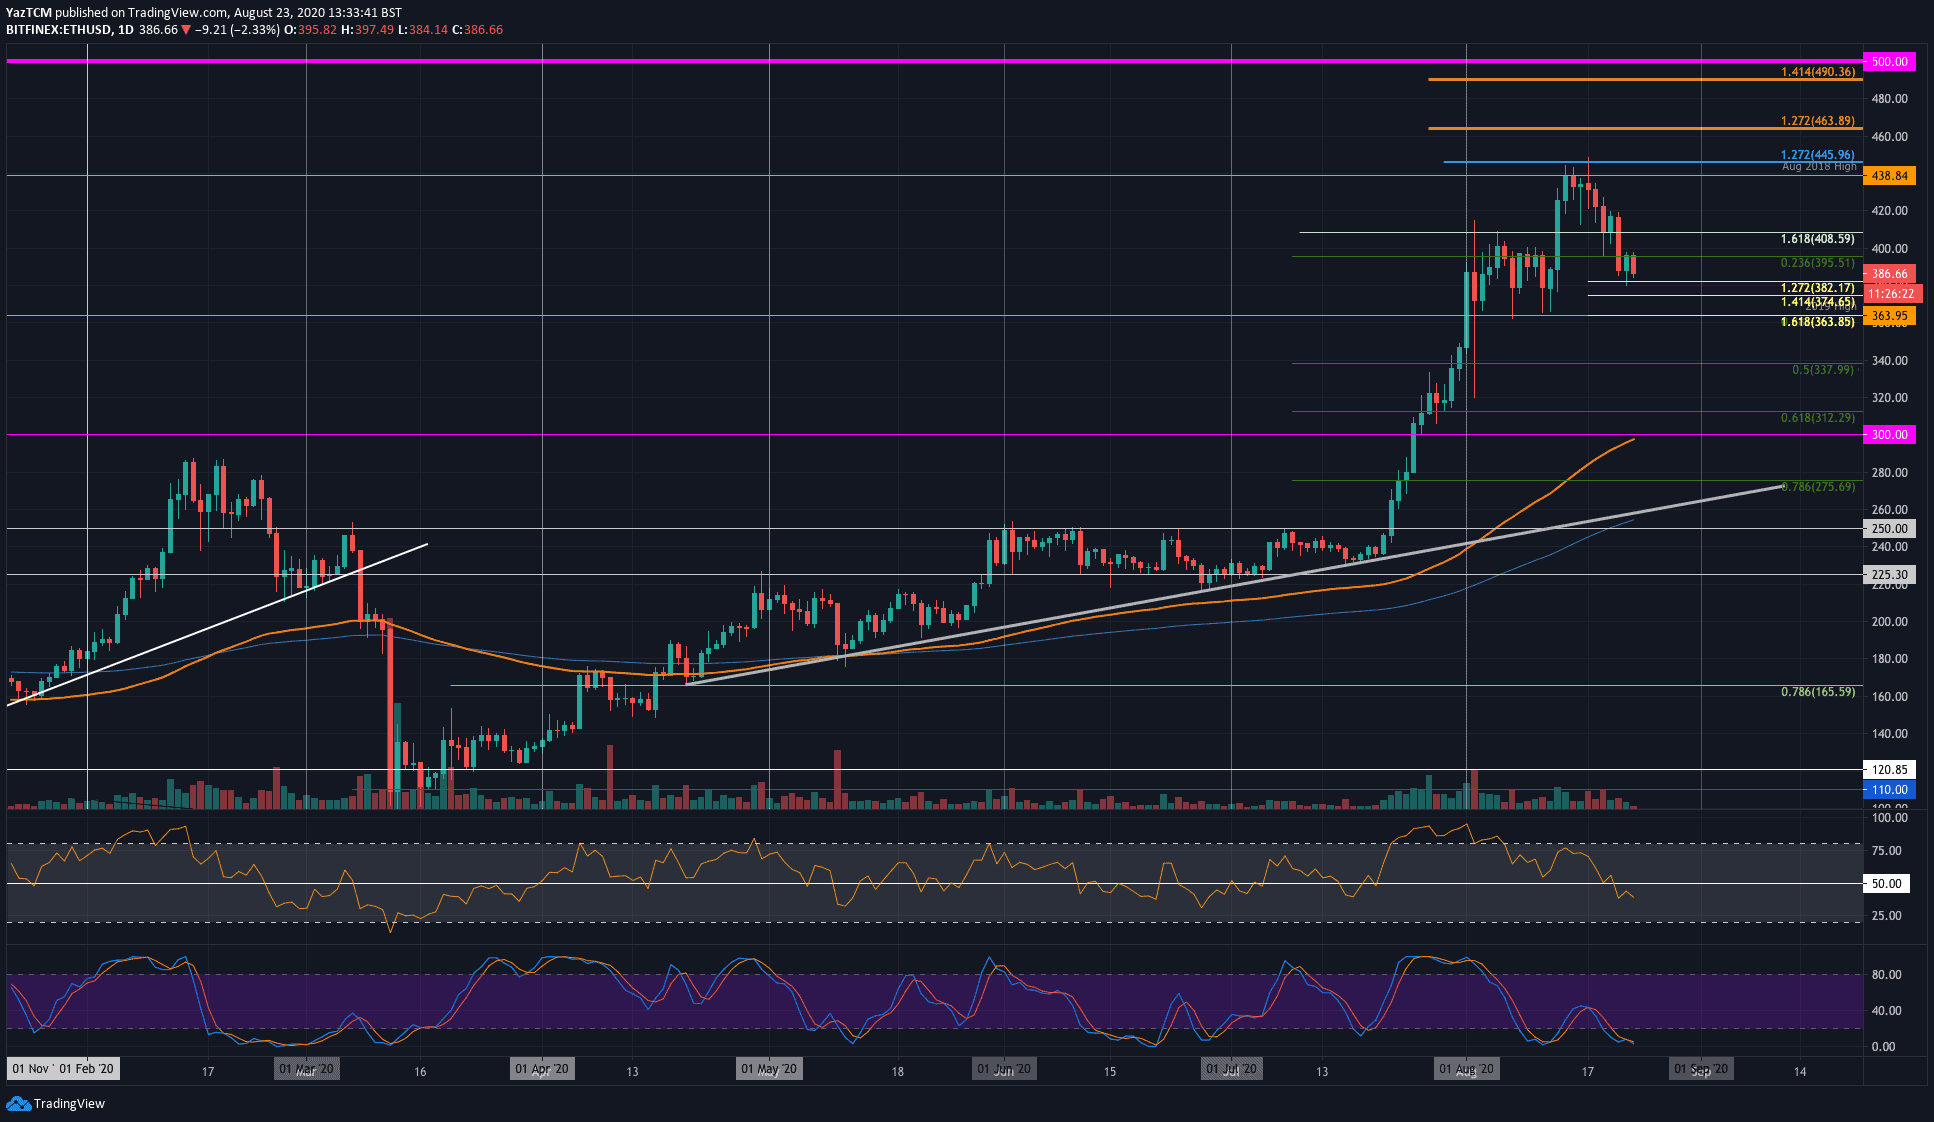
Key Support Levels: $382, $375, $363, $340.
Key Resistance Levels: $400, $408, $420.
Ethereum reached a fresh 2-year high during mid-August, almost touching $450 (Binance), surpassing the key-level resistance of $438 (August 2018 high). Unfortunately, It was unable to daily close above the latter resistance as ETH rolled over, along with Bitcoin that couldn’t sustain the $12,000 mark.
ETH initially found support at $408 but was unable to hold these highs as it crashed beneath $400 and $395 (.236 Fib Retracement) to reach the $382 support (downside 1.272 Fib Extension).
Etheruem remains within the August range between $438 and $363. However, the momentum shifted from bullish to short-term bearish after the RSI penetrated beneath the 50 line. On the macro level, ETH is on a bullish track.
ETH-USD Short Term Price Prediction
If the sellers push ETH beneath $382, the next support lies at $375 (downside 1.414 Fib Extension). This is followed by significant support at the bottom of the August range at $363, provided by a confluence from the .382 Fib Retracement, the 2019 high, and a downside 1.618 Fib Extension. If $363 breaks, further support lies at $340 (.5 Fib Retracement).
Alternatively, if the bulls can rebound from current levels (around $390), then the first level of resistance lies at the psychological mark of $400. This is followed by resistance at $408, $420, and $438 (Aug 2018 high).
As mentioned, the RSI has dropped beneath the 50 line, and if it continues to fall, the increased bearish pressure could drive Ethereum toward the lower boundary of the August range. Fortunately, the Stochastic RSI is already oversold and looks primed for a bullish crossover signal.
ETH/BTC – Bears Push ETH Beneath The March 2019 Support
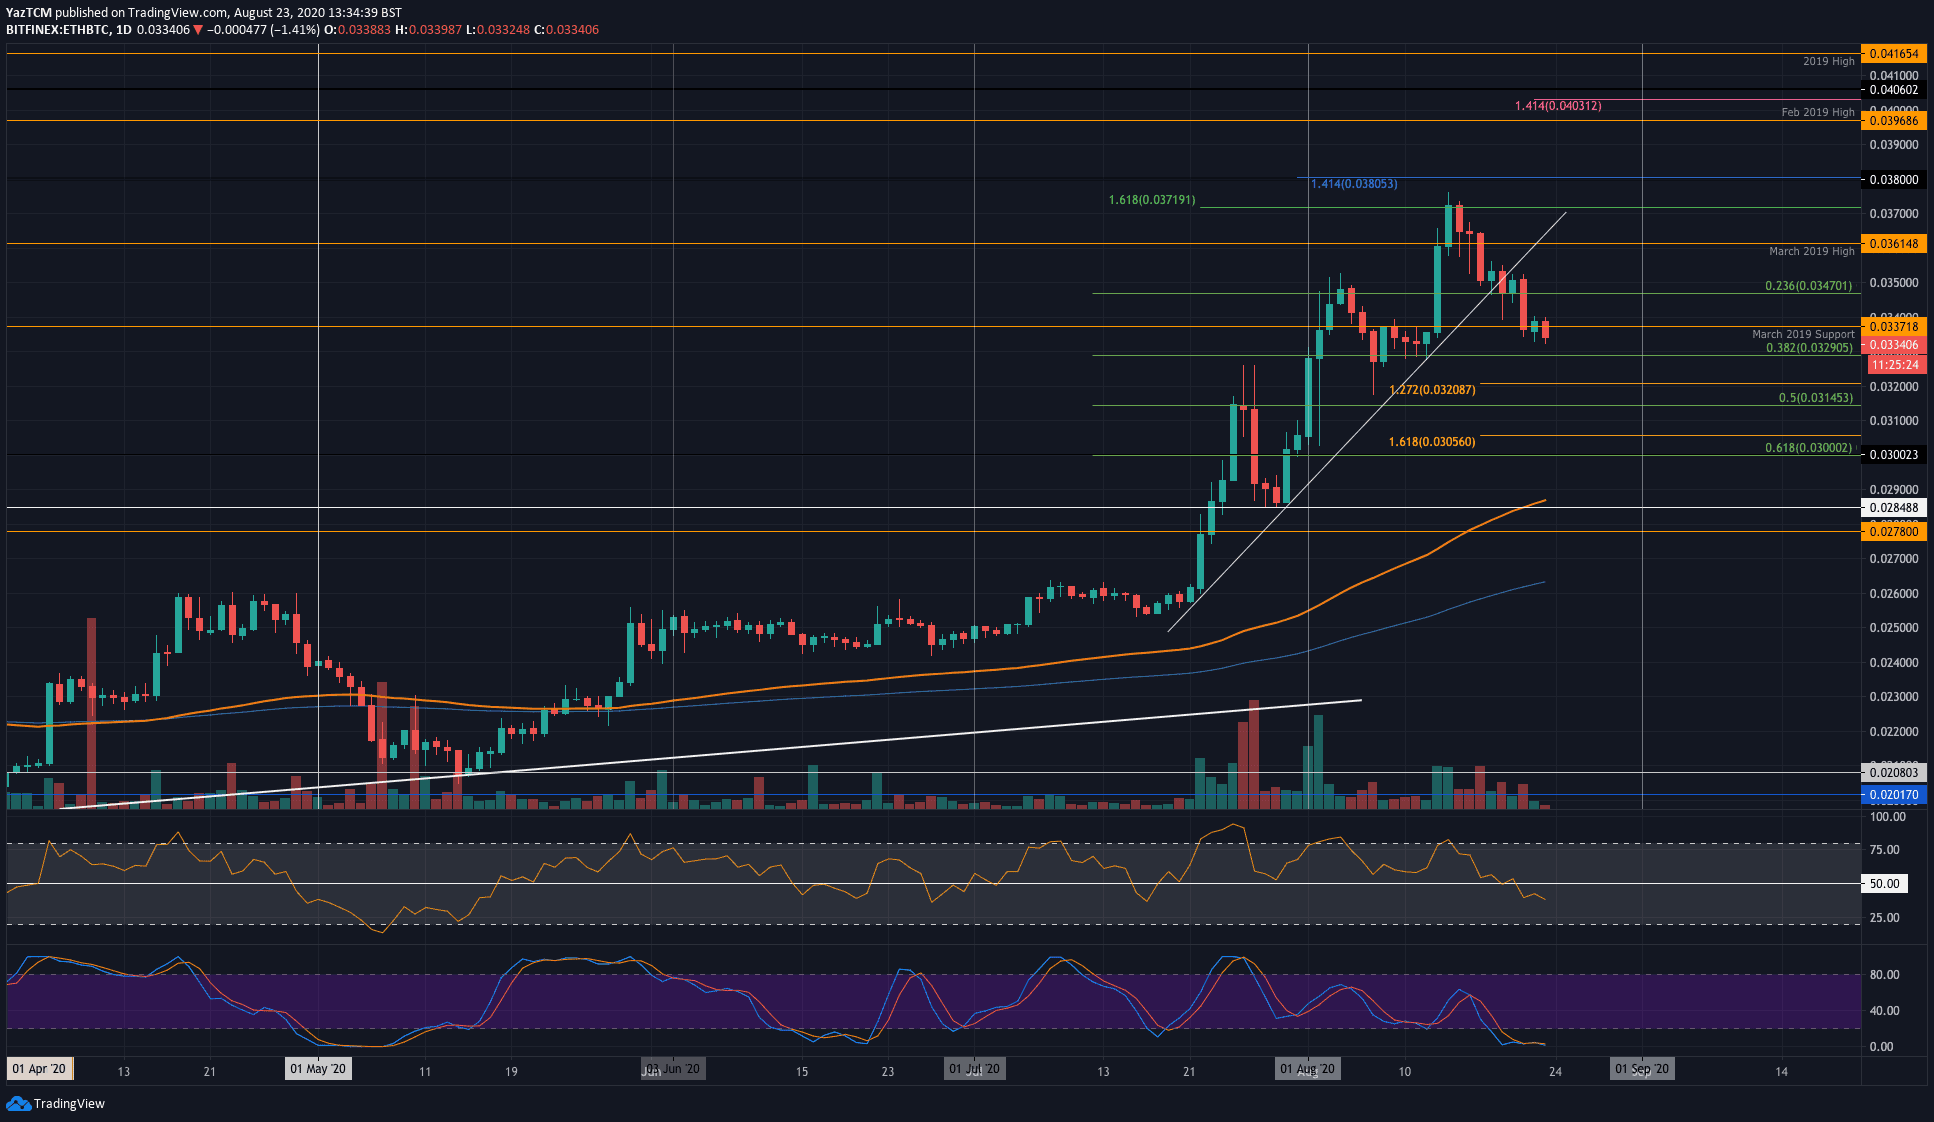
Key Support Levels: 0.0329 BTC, 0.032 BTC, 0.0314 BTC.
Key Resistance Levels: 0.0337 BTC, 0.0035 BTC, 0.0361 BTC.
Against Bitcoin, Ethereum has dropped even harder. ETH reached the 0.037 – 0.38 BTC level in mid-August and has headed further lower since then. It found initial support at 0.0347 BTC (.236 Fib Retracement) but continued to plummet beneath this support at the end of the week.
Today, Ethereum dropped beneath the March 2019 support as the bearish pressure continues to increase. As of now, the bulls are trying to defend the horizontal support line at 0.033 BTC.
ETH-BTC Short Term Price Prediction
Looking ahead, if the sellers continue to drive ETH/BTC lower, the first level of support lies at 0.0329 BTC (.382 Fib Retracement). This is followed by support at 0.032 BTC (downside 1.272 Fib Extension) and 0.0314 BTC (.5 Fib Retracement).
Alternatively, if the buyers regroup and push above 0.0337 BTC, resistance lies at 0.035 BTC, 0.0361 BTC (March 2019 high), and 0.0371 BTC (August 2020 highs).
Likewise, the RSI has dipped beneath the 50 line, which suggests that the sellers are in control of the market momentum. Similarly, the Stochastic RSI is already oversold and is primed for a bullish crossover signal that could put the brakes on the current short term retracement.
LIMITED OFFER 2024 for CryptoPotato readers at Bybit: Use this link to register and open a $500 BTC-USDT position on Bybit Exchange for free!
Disclaimer: Information found on CryptoPotato is those of writers quoted. It does not represent the opinions of CryptoPotato on whether to buy, sell, or hold any investments. You are advised to conduct your own research before making any investment decisions. Use provided information at your own risk. See Disclaimer for more information.
Cryptocurrency charts by TradingView.


