

Bitcoin
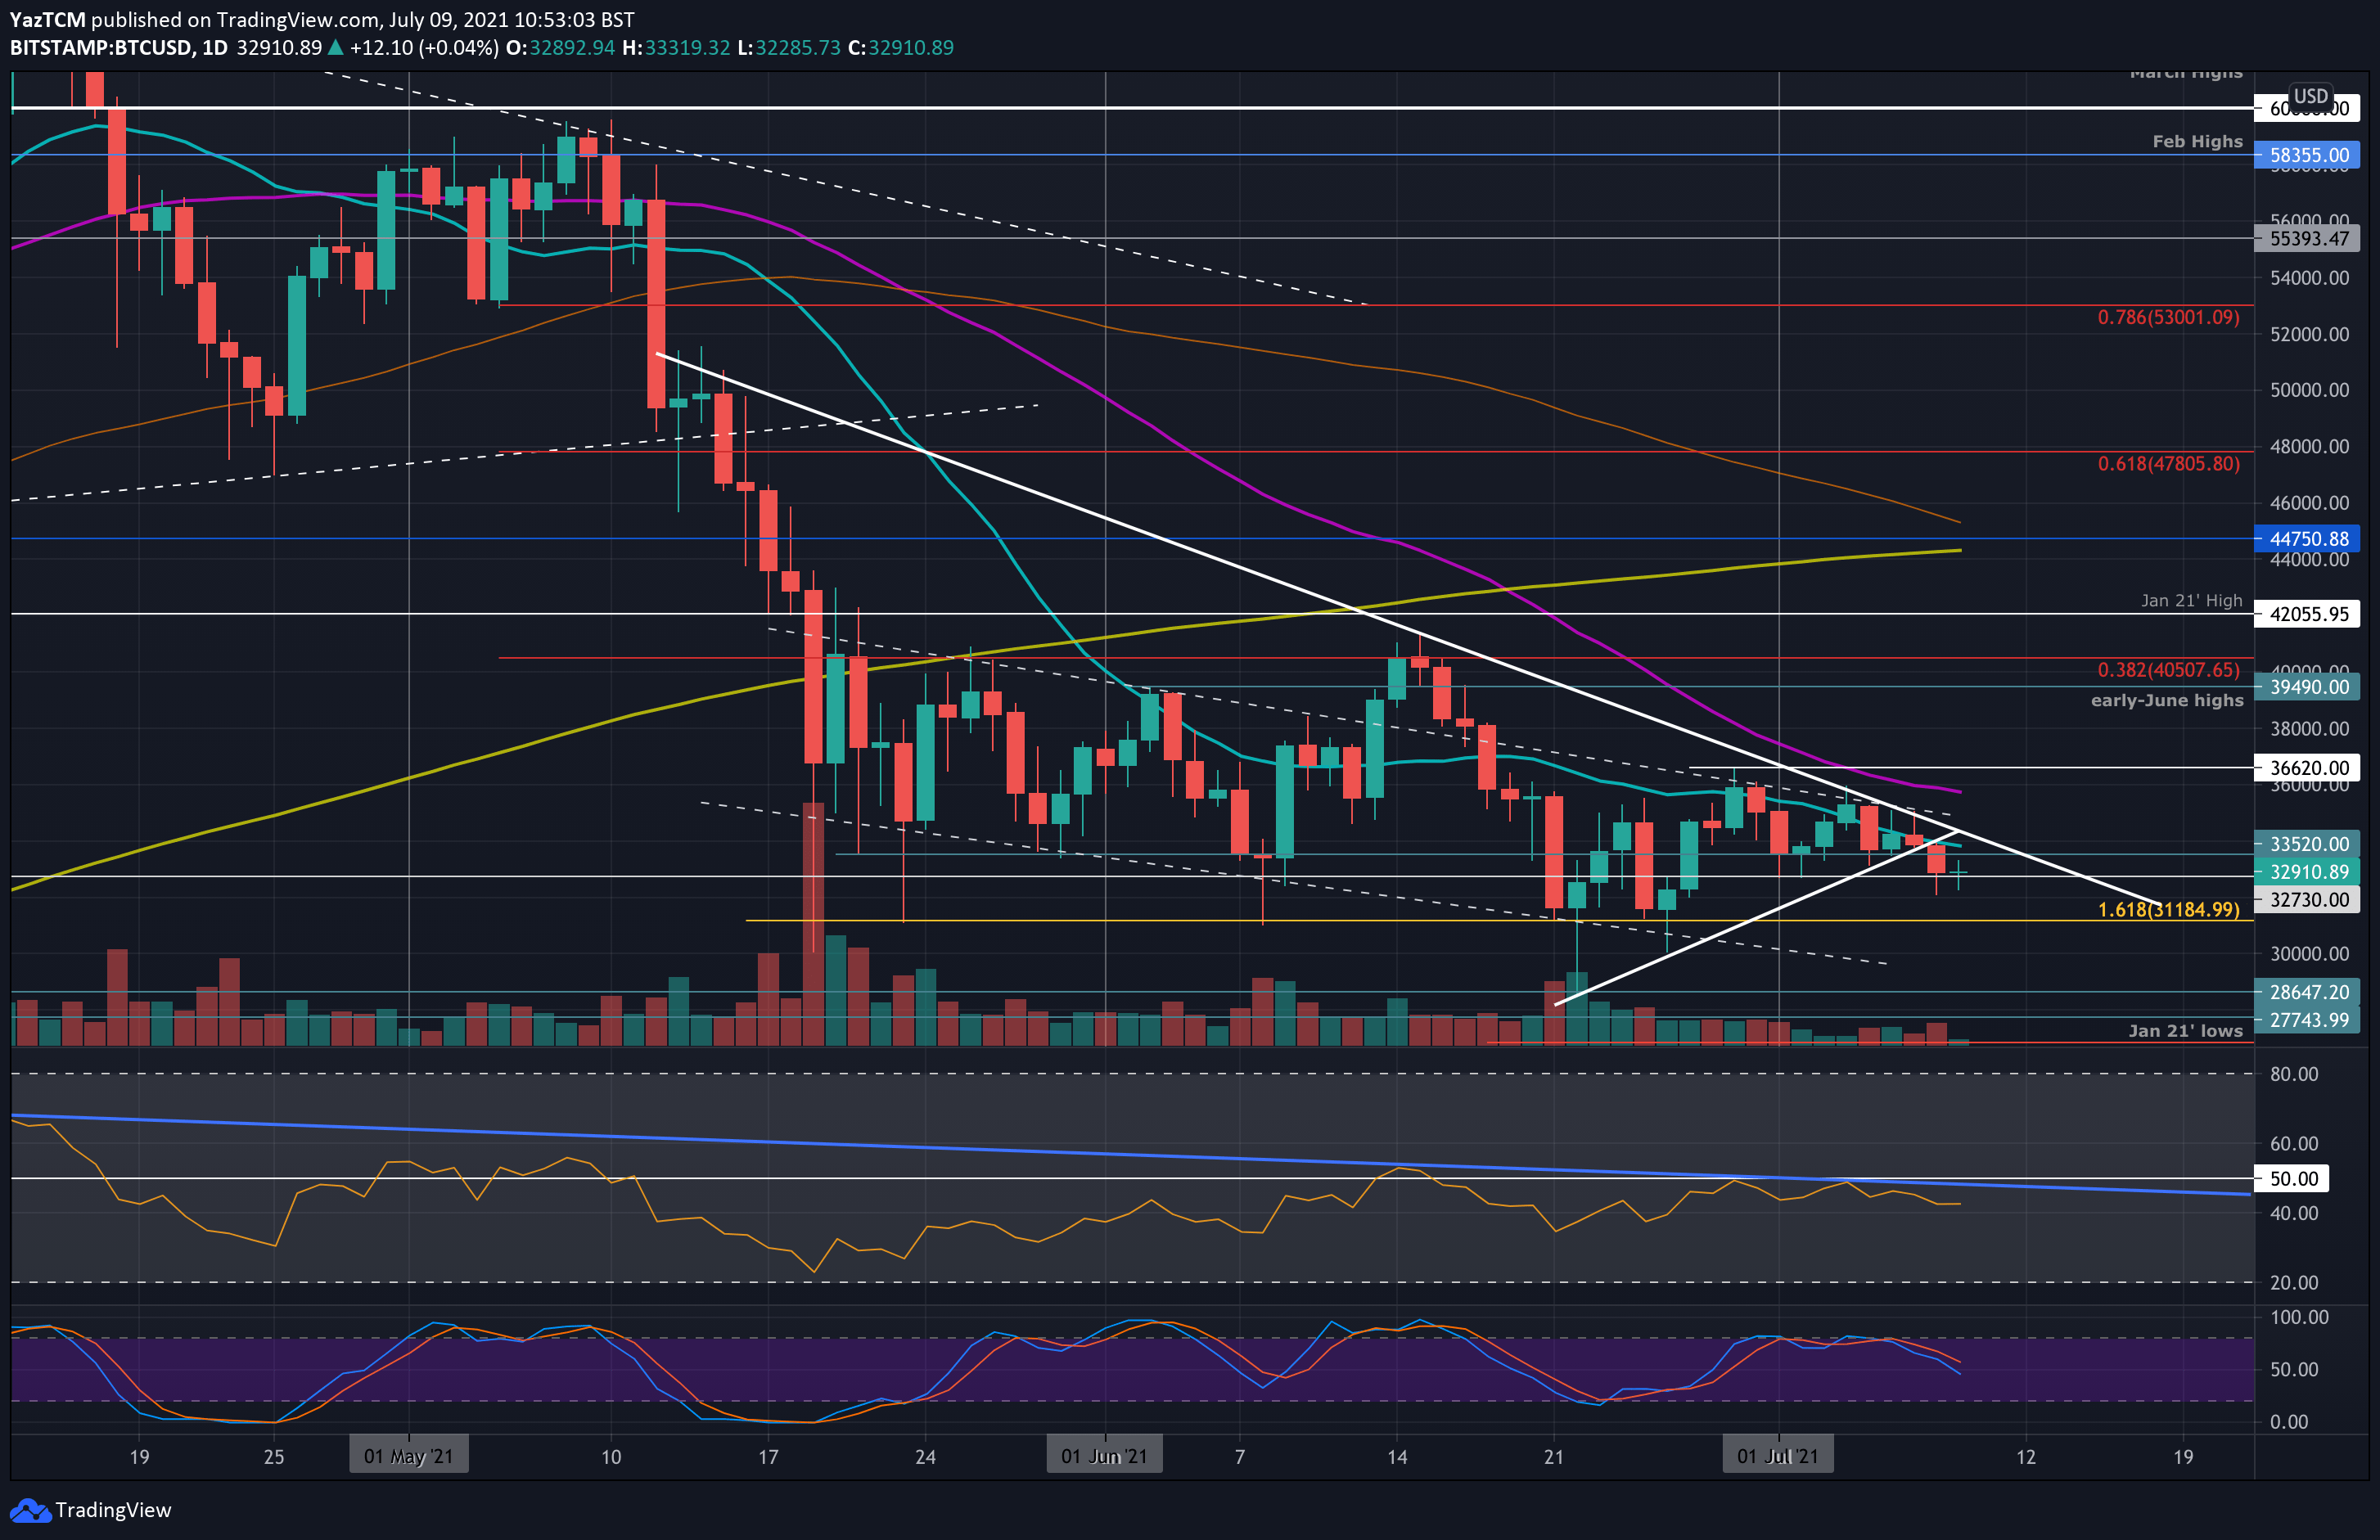
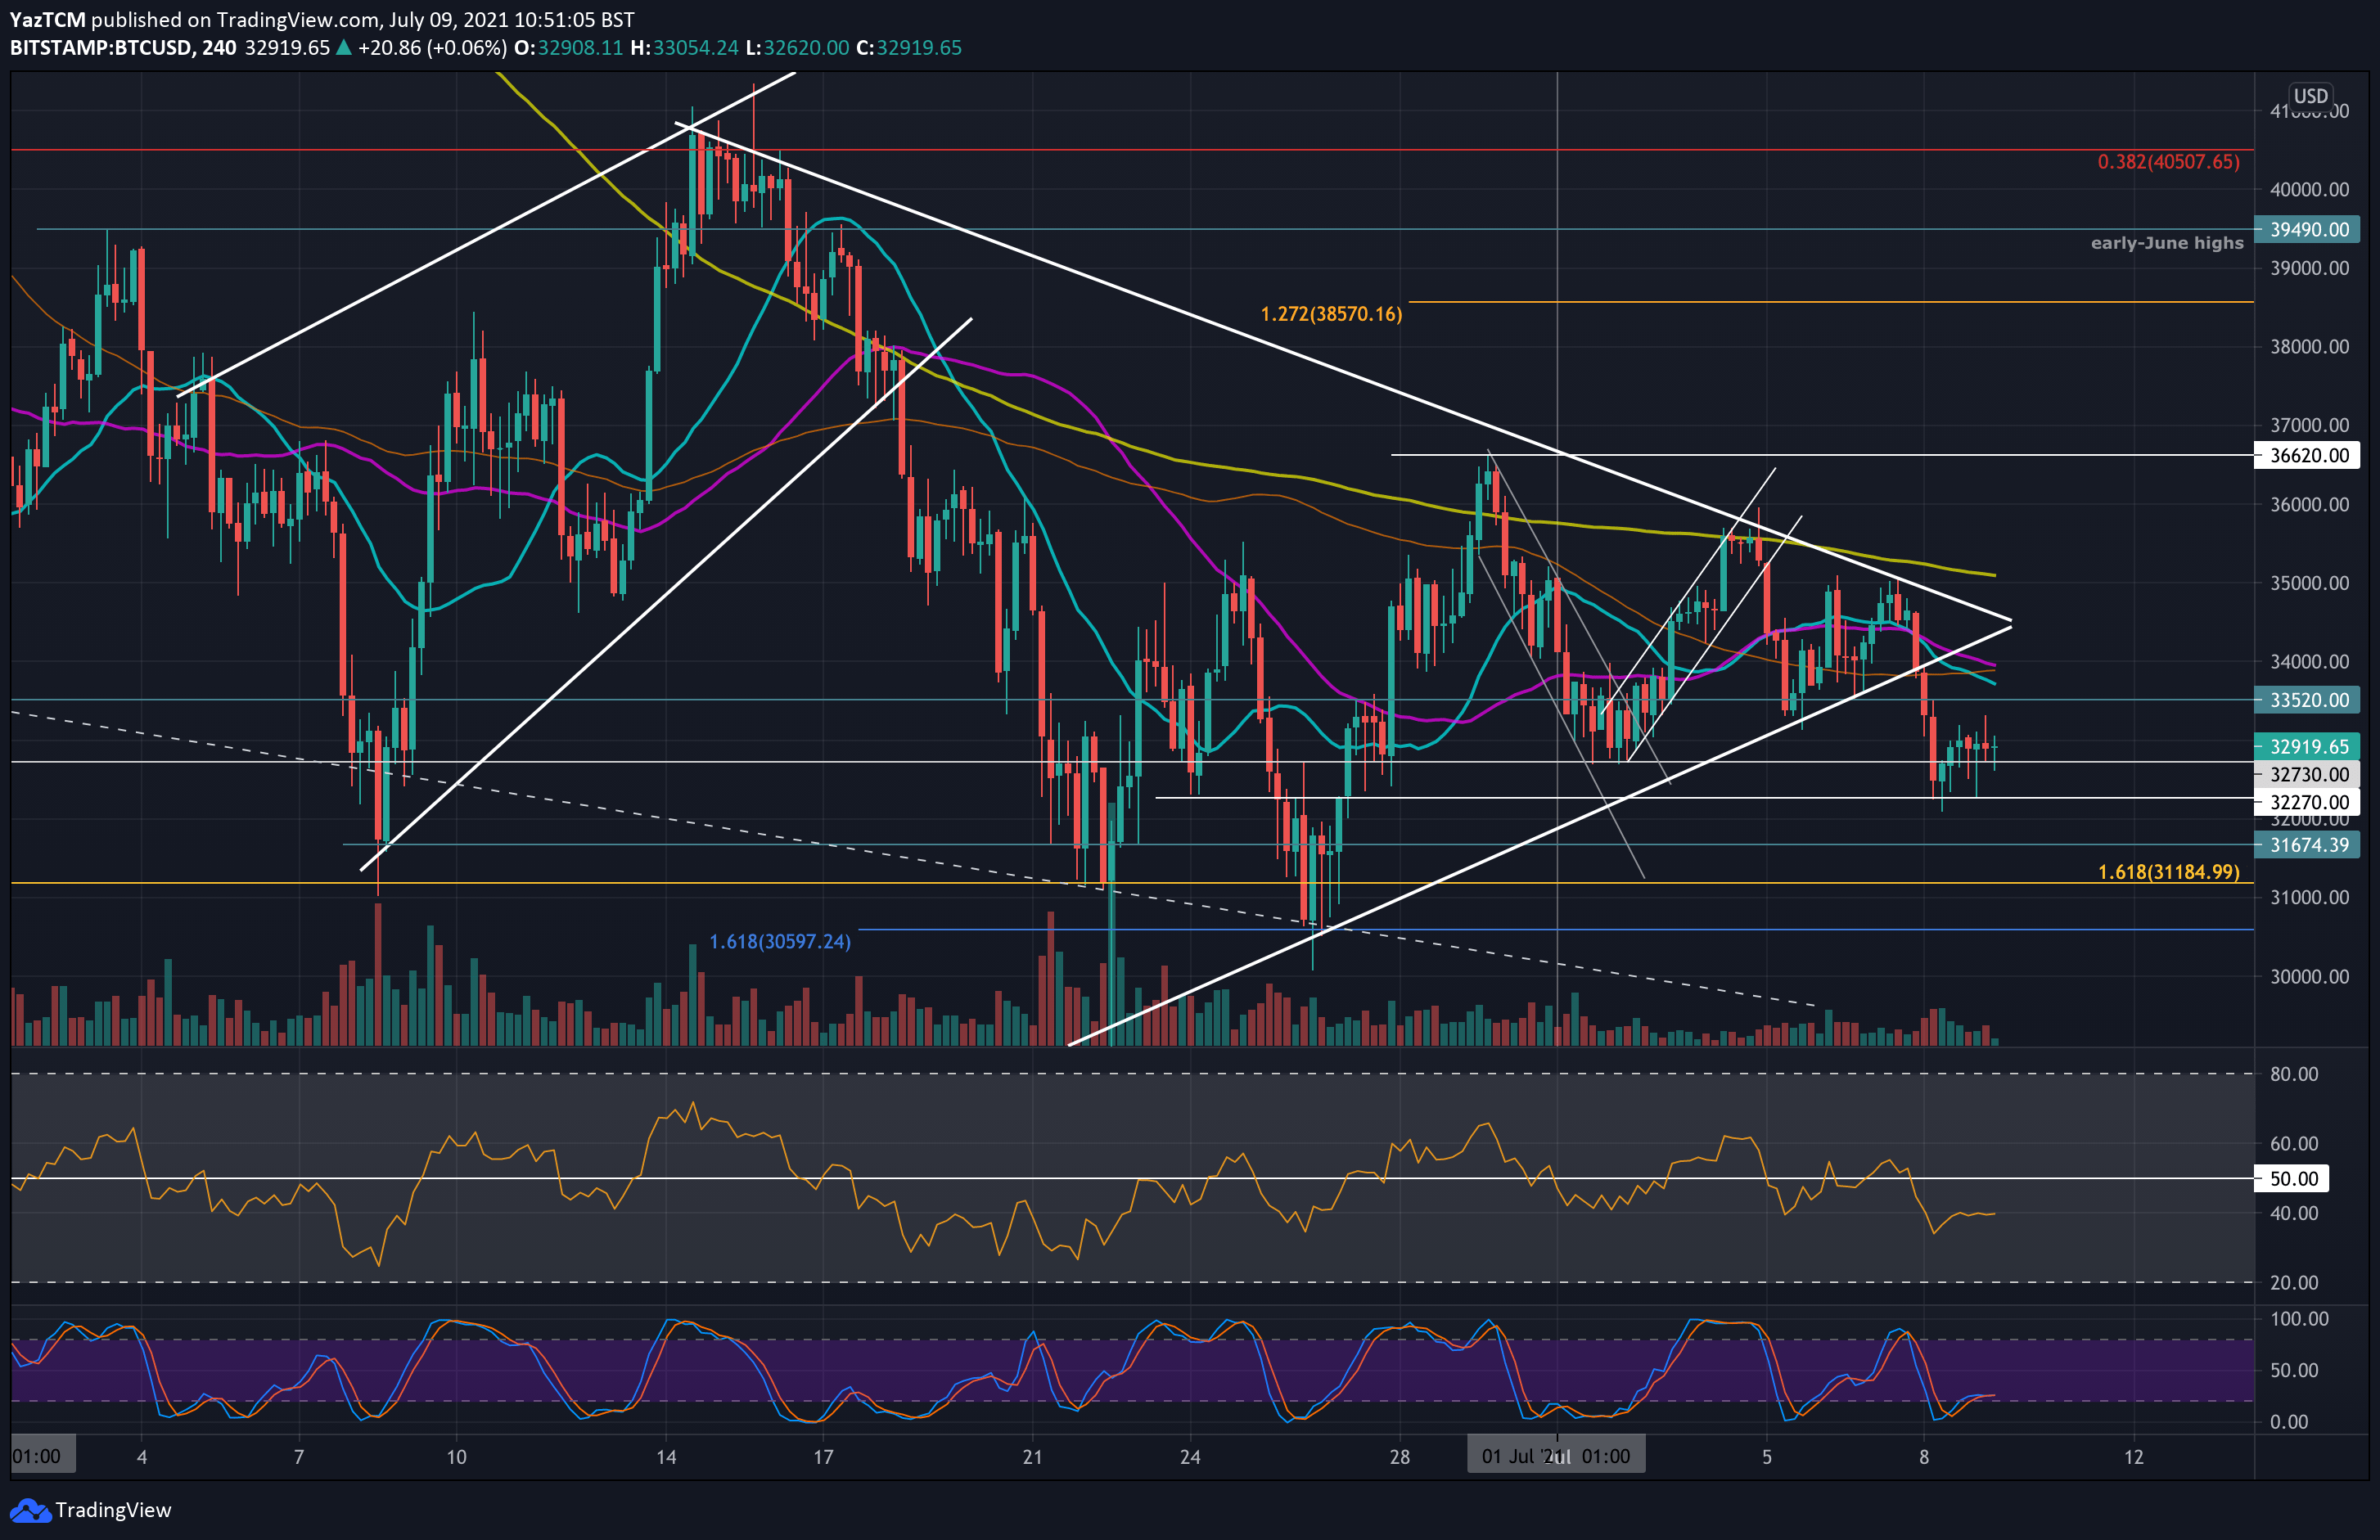
After another volatile week, Bitcoin is currently down 2% on the weekly. BTC rebounded from $33K on Monday and pushed higher to meet the upper angle of a symmetrical triangle pattern, as seen on the charts below.
Unfortunately, BTC could not break out and quickly rolled over from there into $33,520 support on Tuesday. After another failed retest of the upper angle on Wednesday (at $35K), BTC heavily rejected and broke to the downside.
Since the breakdown of the triangle, it has found support at $32K, which was the lowest price BTC traded at over the past two weeks, and as of now, BTC is mostly consolidating around the $33K mark.
Looking ahead, the first support lies between $32,730 and $32,270. This is followed by $31,600 (double-bottom support), $31,185 (downside 1.618 Fib Extension), $30,600, and $30,000.
On the other side, the first resistance lies at $33,000. This is followed by $33,520, $34,000 (20-day MA & descending trend-line), $35,000, and $35,900 (50-day MA).
Ethereum
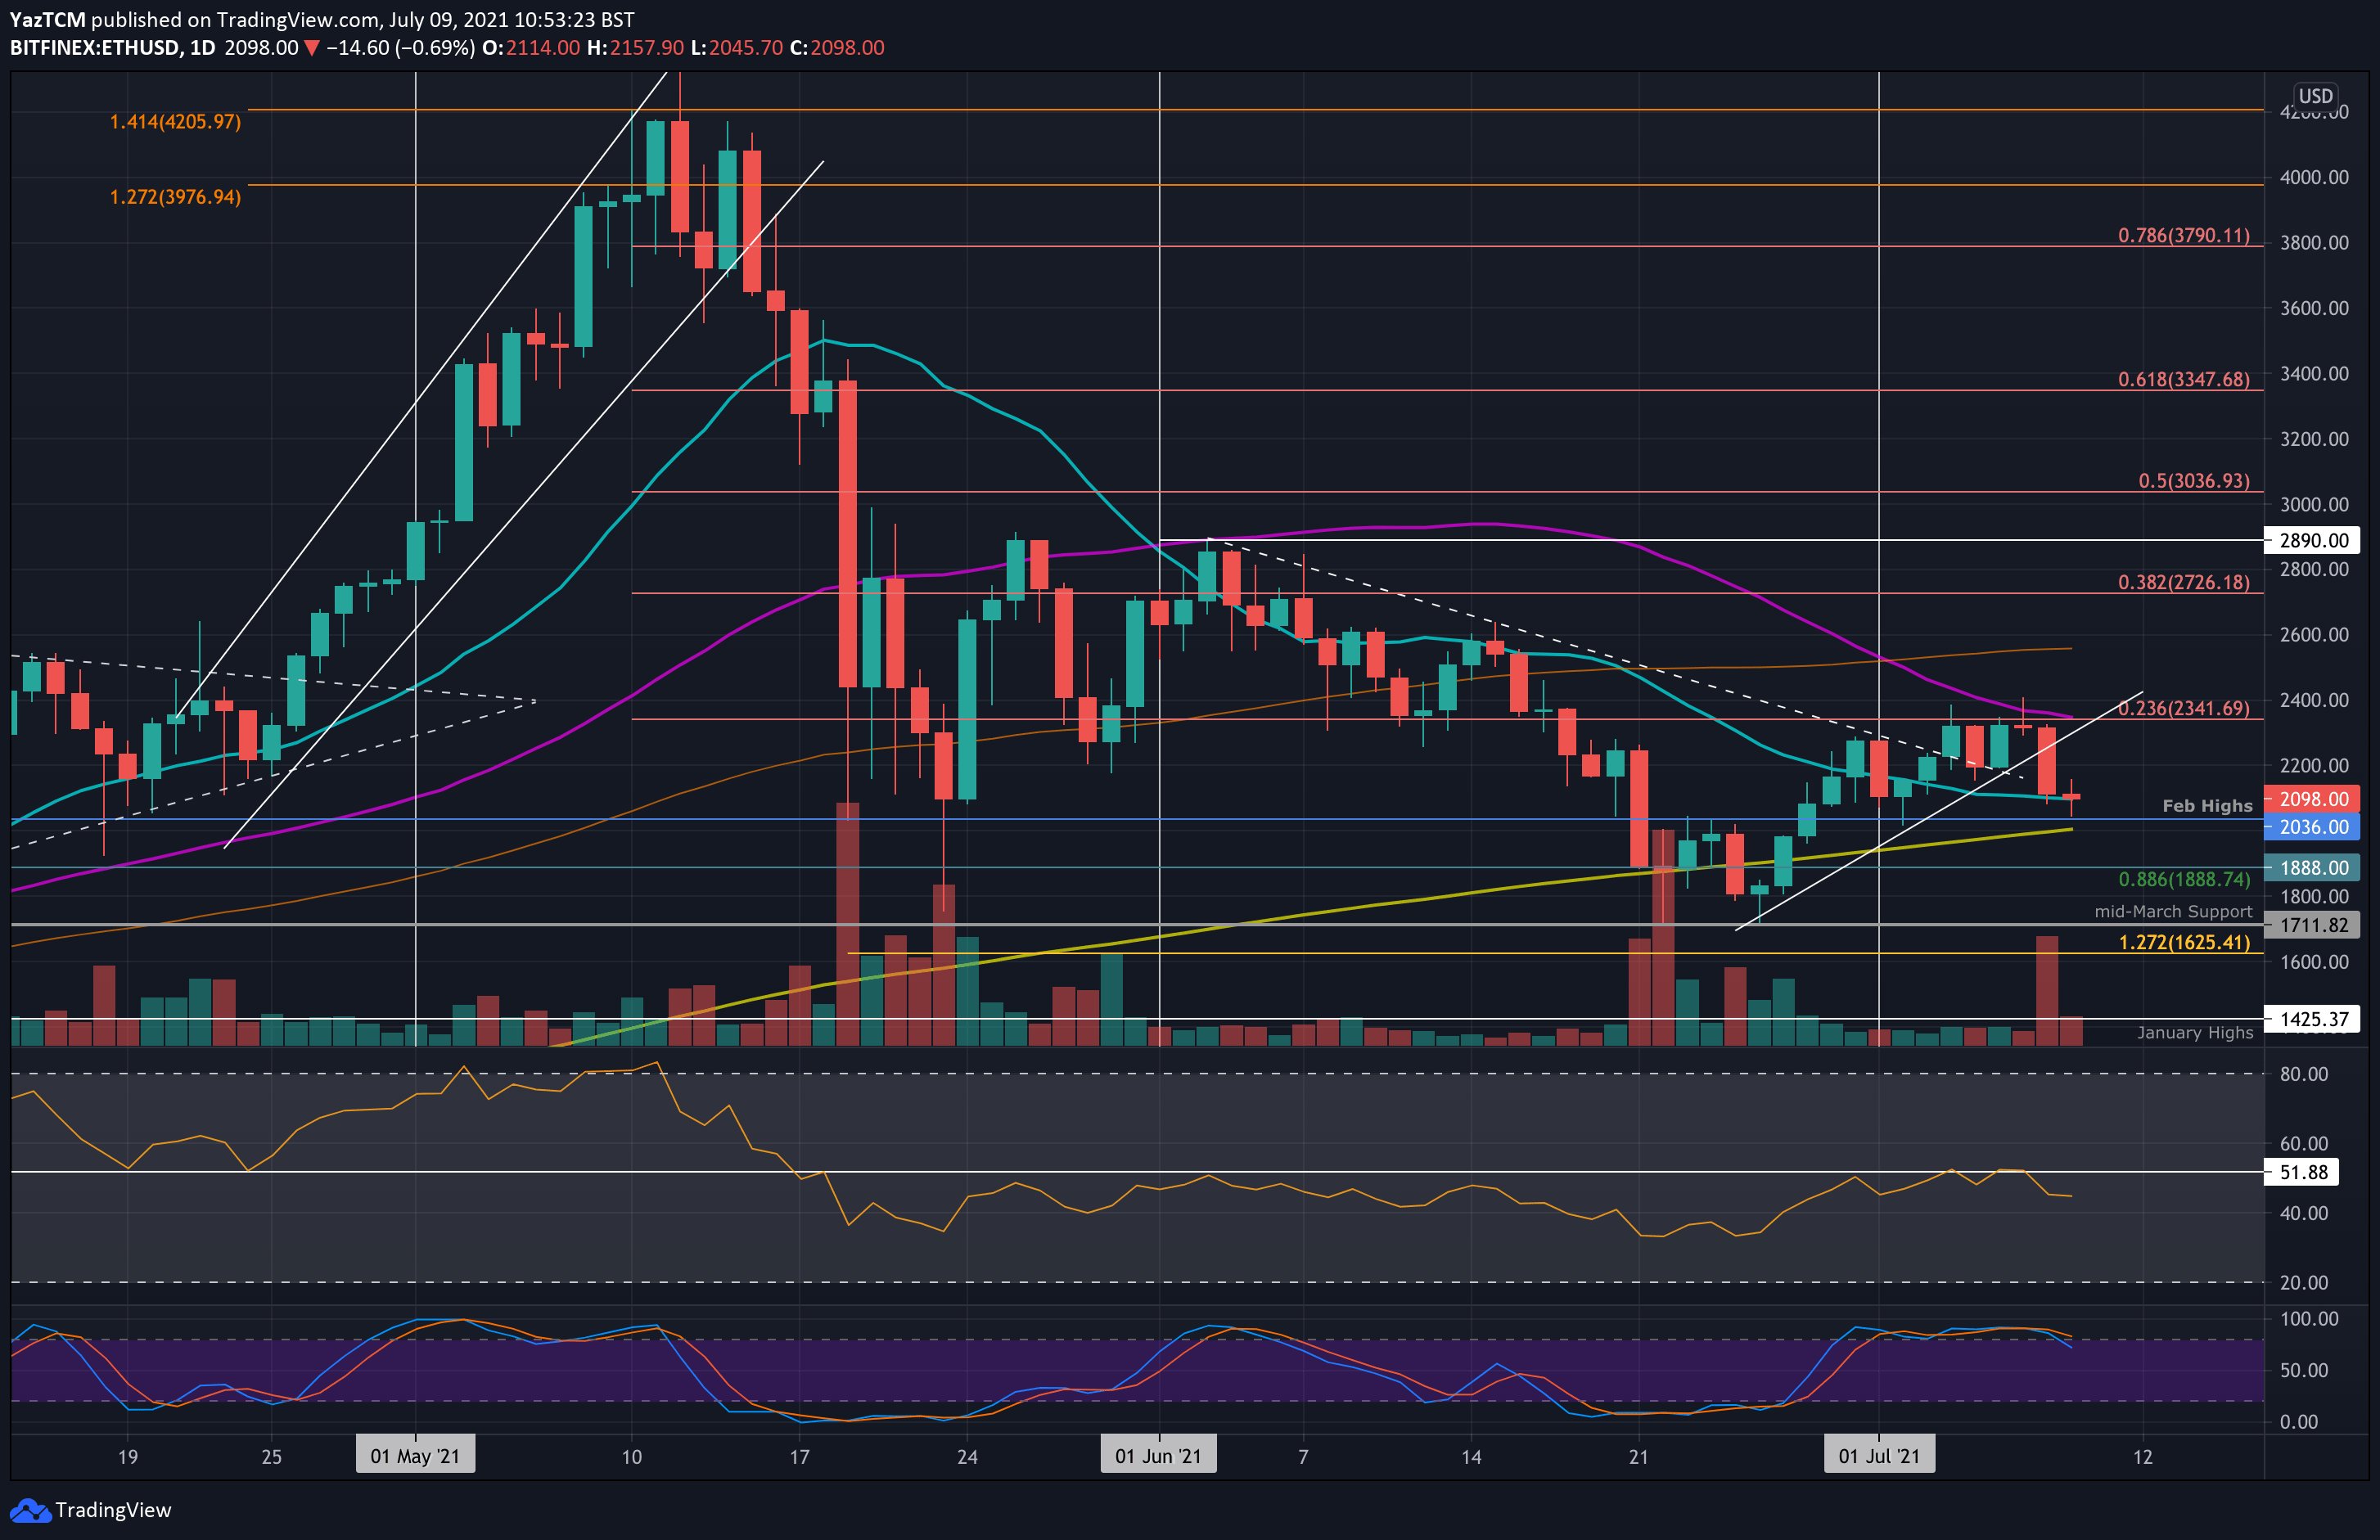
Ethereum is trading near the same price from a week ago, amid the $2K mark. The coin bounced from the 20-day MA at around $2080 at the start of the week and pushed higher into the $2340 – 2400 resistance zone (MA-50 and 0.236 Fib level), failing to break above it on two occasions – Sunday and Wednesday.
After multiple failed attempts to sustain $2340, ETH rolled over yesterday after hitting the 50-day MA the day before. It then broke a short-term rising wedge and collapsed back into the 20-day MA zone around $2100. As of earlier today, ETH spiked lower to $2035 (Feb-2021 highs) but has bounced back since, attempting to remain above the 20-day MA once again.
Looking ahead, the first major resistance lies at $2200. This is followed by $2340 – $2400 (bearish .236 Fib & 50-day MA), $2560 (100-day MA), and $2725 (bearish .382 Fib).
On the other side, the first support lies at $2100 (20-day MA). This is followed by $2000 (200-day MA), $1888 (.886 Fib), and $1710 (mid-March support).
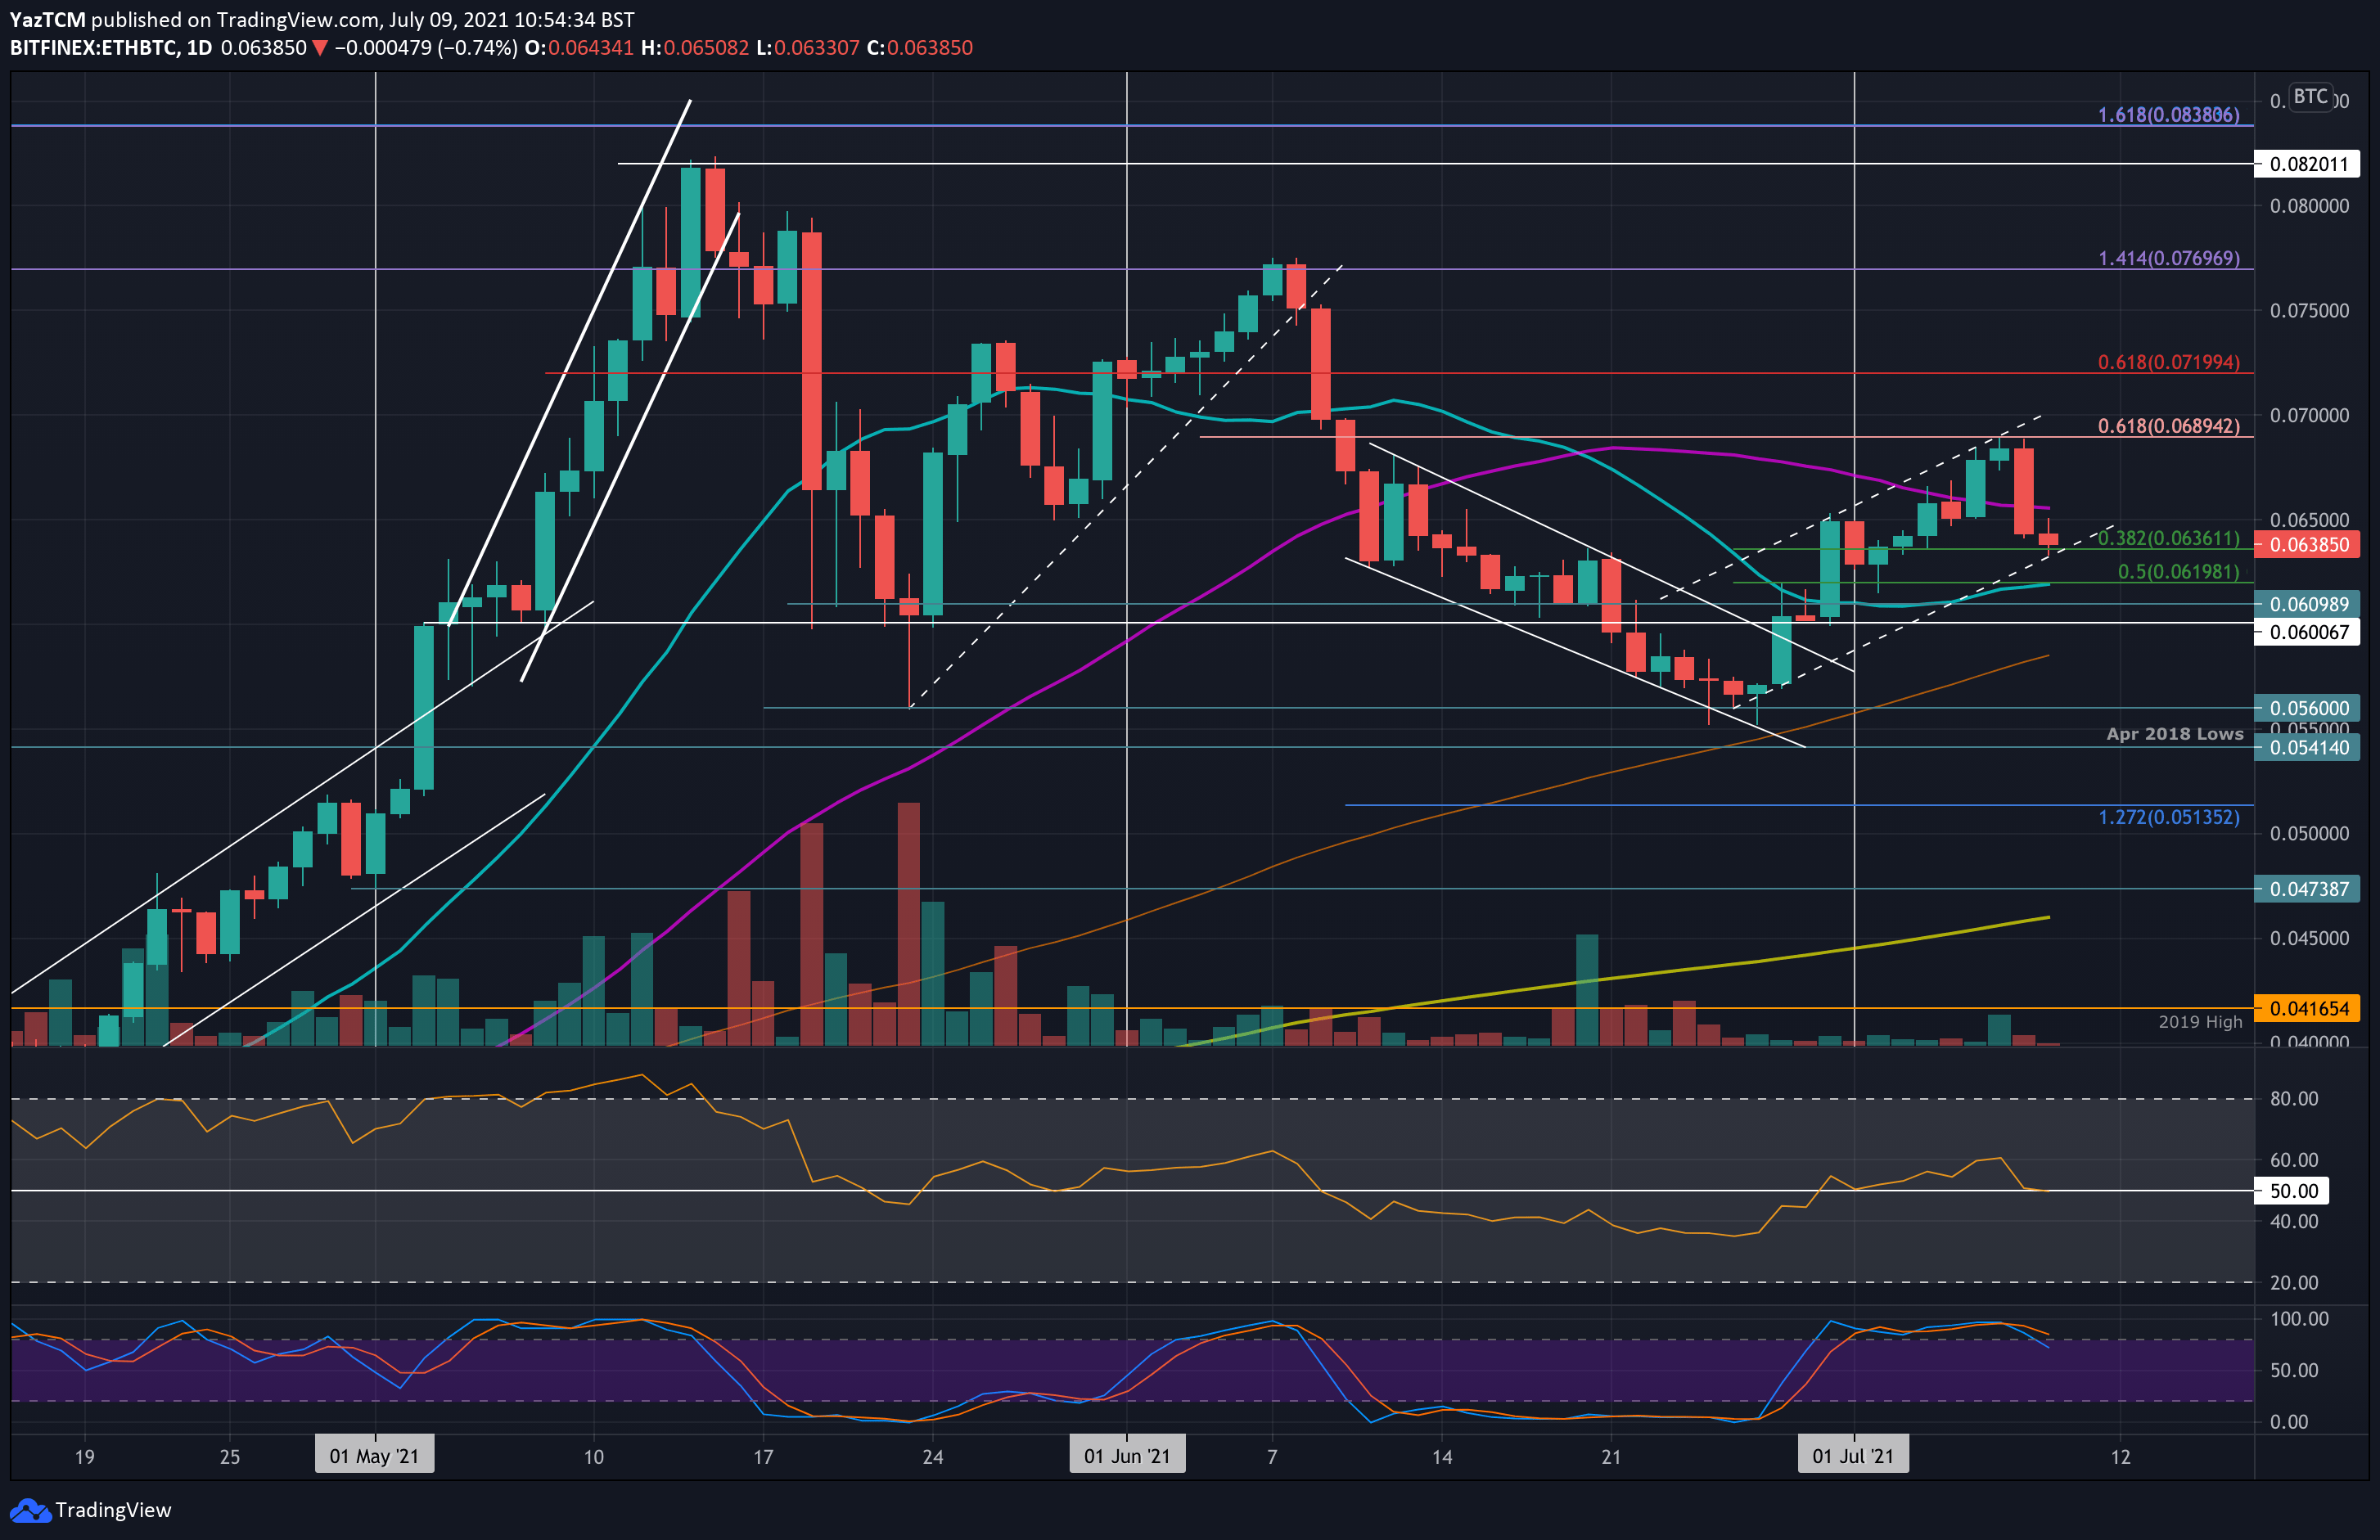
Against bitcoin, ETH/BTC has been trading inside a rising wedge since the end of June. The coin bounced from 0.0636 BTC at the start of the week and pushed higher above the 50-day MA at 0.066 BTC to reach as high as 0.0689 BTC.
There, it found resistance at a short-term bearish .618 Fib Retracement and rolled over yesterday. Finally, it collapsed beneath the 50-day MA, breaking beneath the wedge, and continued into support at 0.0636 BTC today, provided by a .382 Fib and the lower angle of the price channel.
Moving forward, if the sellers break 0.0636 BTC, the first support lies at 0.0619 BTC (MA-20 & .5 Fib). This is followed by 0.061 BTC, 0.06 BTC, and 0.0585 BTC.
On the other side, the first resistance lies at 0.065 BTC (50-day MA). This is followed by 0.0689 – 0.07 BTC (short-term bearish .618 Fib), and 0.072 BTC (bearish .618 Fib).
Ripple
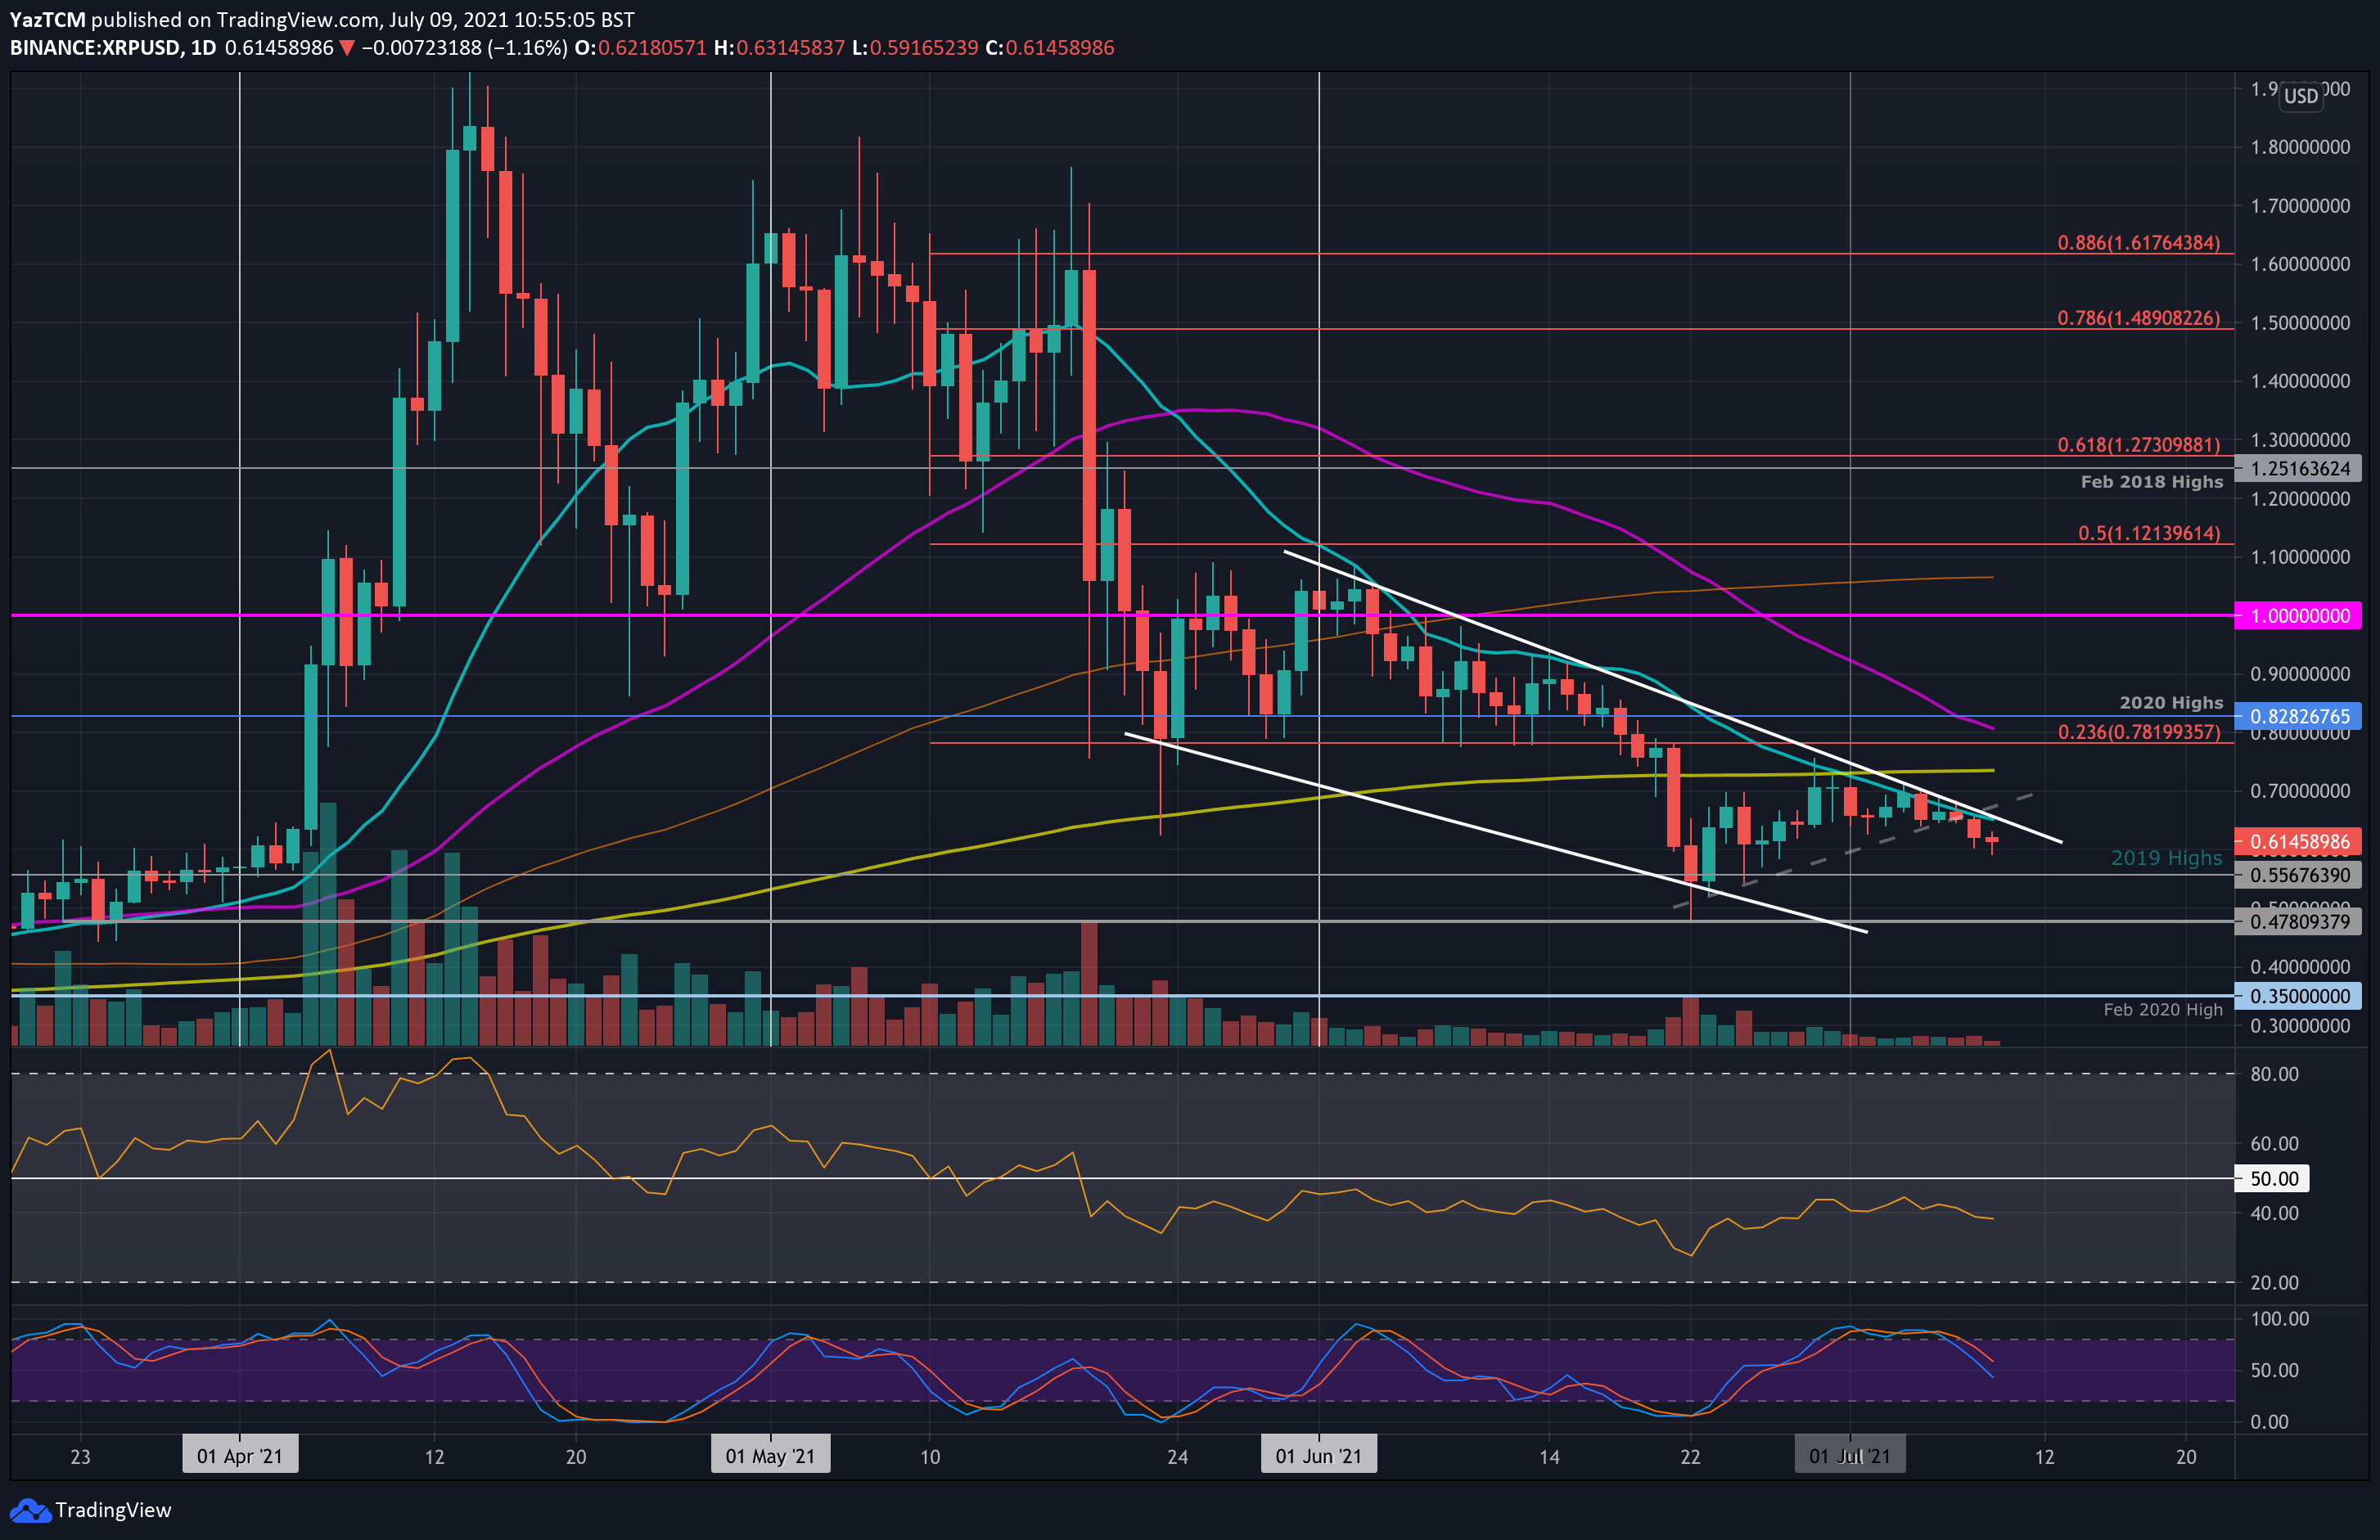
XRP is down a sharp 7% this week as the coin heads into the $0.6 support area. The cryptocurrency has been trading inside a descending price channel since the start of June and has been trading beneath the 20-day MA since the start of July.
XRP/USD made multiple attempts to break above the 20-day MA, along with the channel, but just like the market sentiment – failed on every attempt. Yesterday XRP broke down into support at $0.6.
Looking ahead, if the bears continue beneath $0.6, the first support lies at $0.556 (2019 highs). This is followed by $0.5, $0.47, $0.4 (lower angle of the price channel), and $0.35 (Feb 2020 highs).
On the other side, the first resistance lies at around $0.65 (20-day MA & descending channel). Above the channel, resistance lies at $0.7, $0.736 (200-day MA), and $0.8 (50-day MA, 2020 highs).
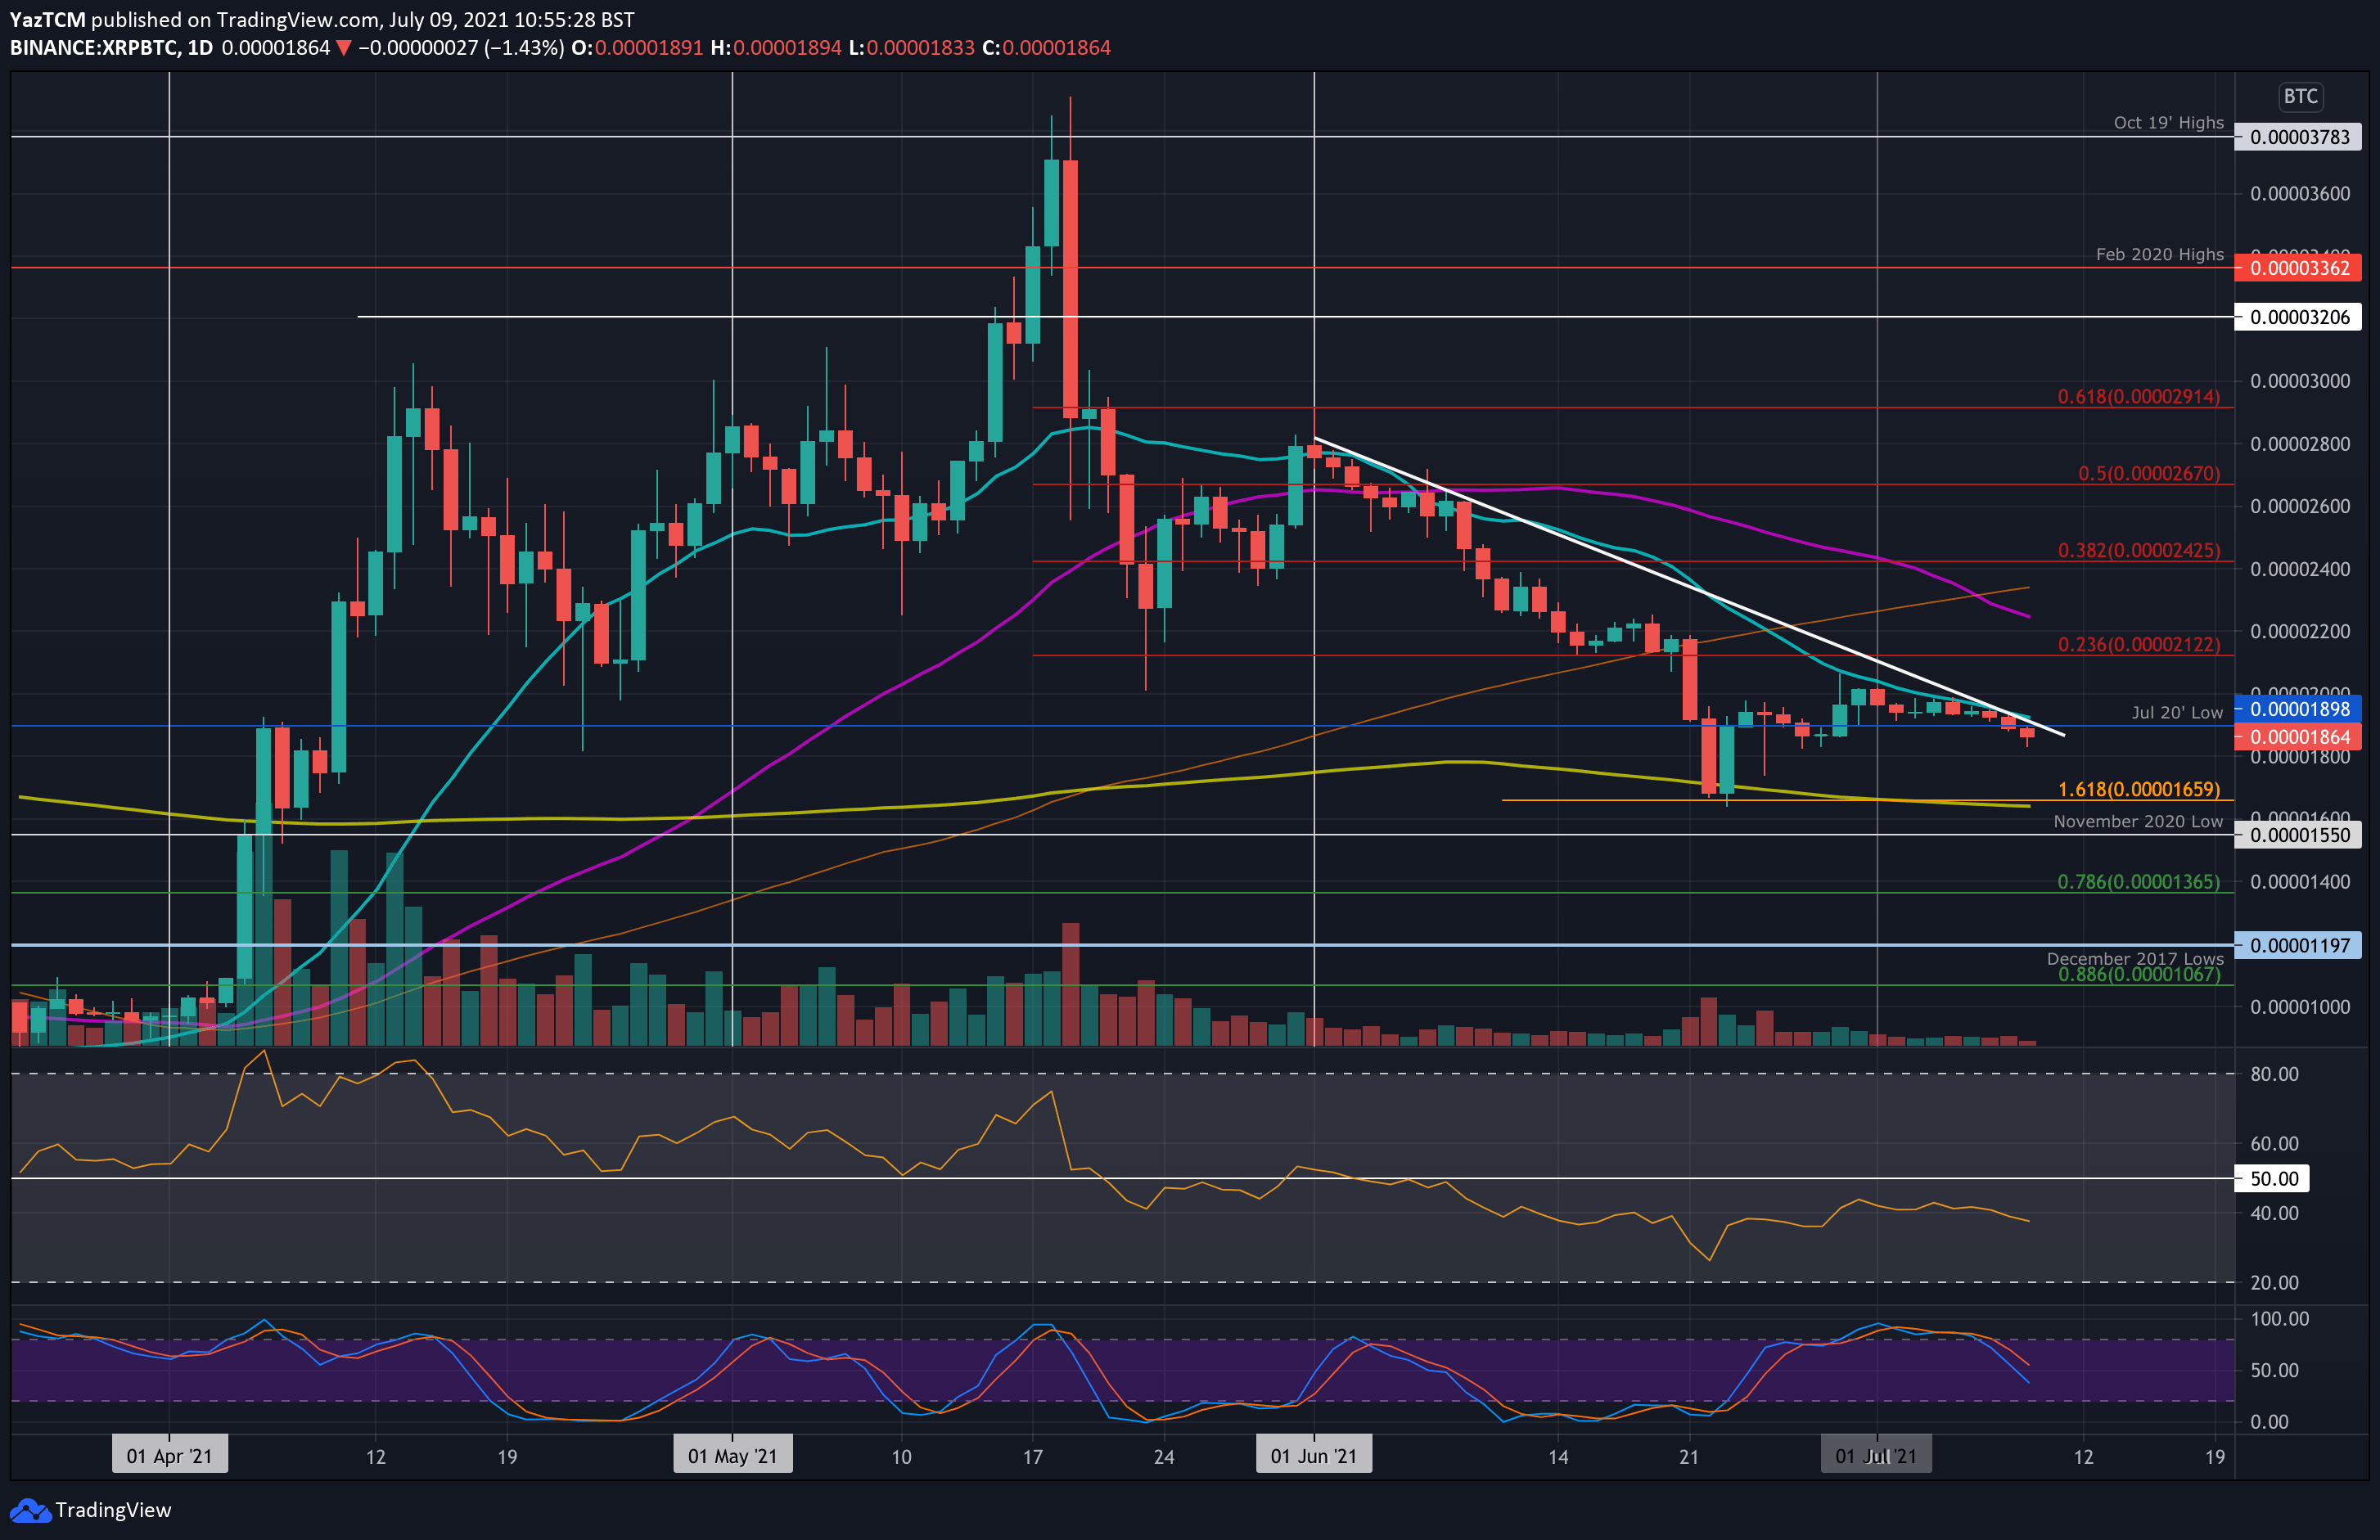
Just like against USD, XRP/BTC is also trading beneath a descending trendline and the MA-20. The coin attempted to break the 20-day MA earlier this week but failed to overcome the 2000 SAT resistance level.
Since then, XRP has slowly ground lower as it broke beneath July 2020 lows at 1900 SAT (yesterday) to reach 1850 SAT earlier today.
Looking ahead, the first support lies at 1800 SAT. This is followed by 1660 SAT (200-day MA), 1550 SAT (November 2020 lows), and 1365 SAT (.786 Fib).
On the other side, the first major resistance lies at 1900 SAT (descending trend line 20-day MA & July 2020 low). This is followed by 2000 SAT, 2120 SAT (bearish .236 Fib), and 2250 SAT (50-day MA).
Cardano
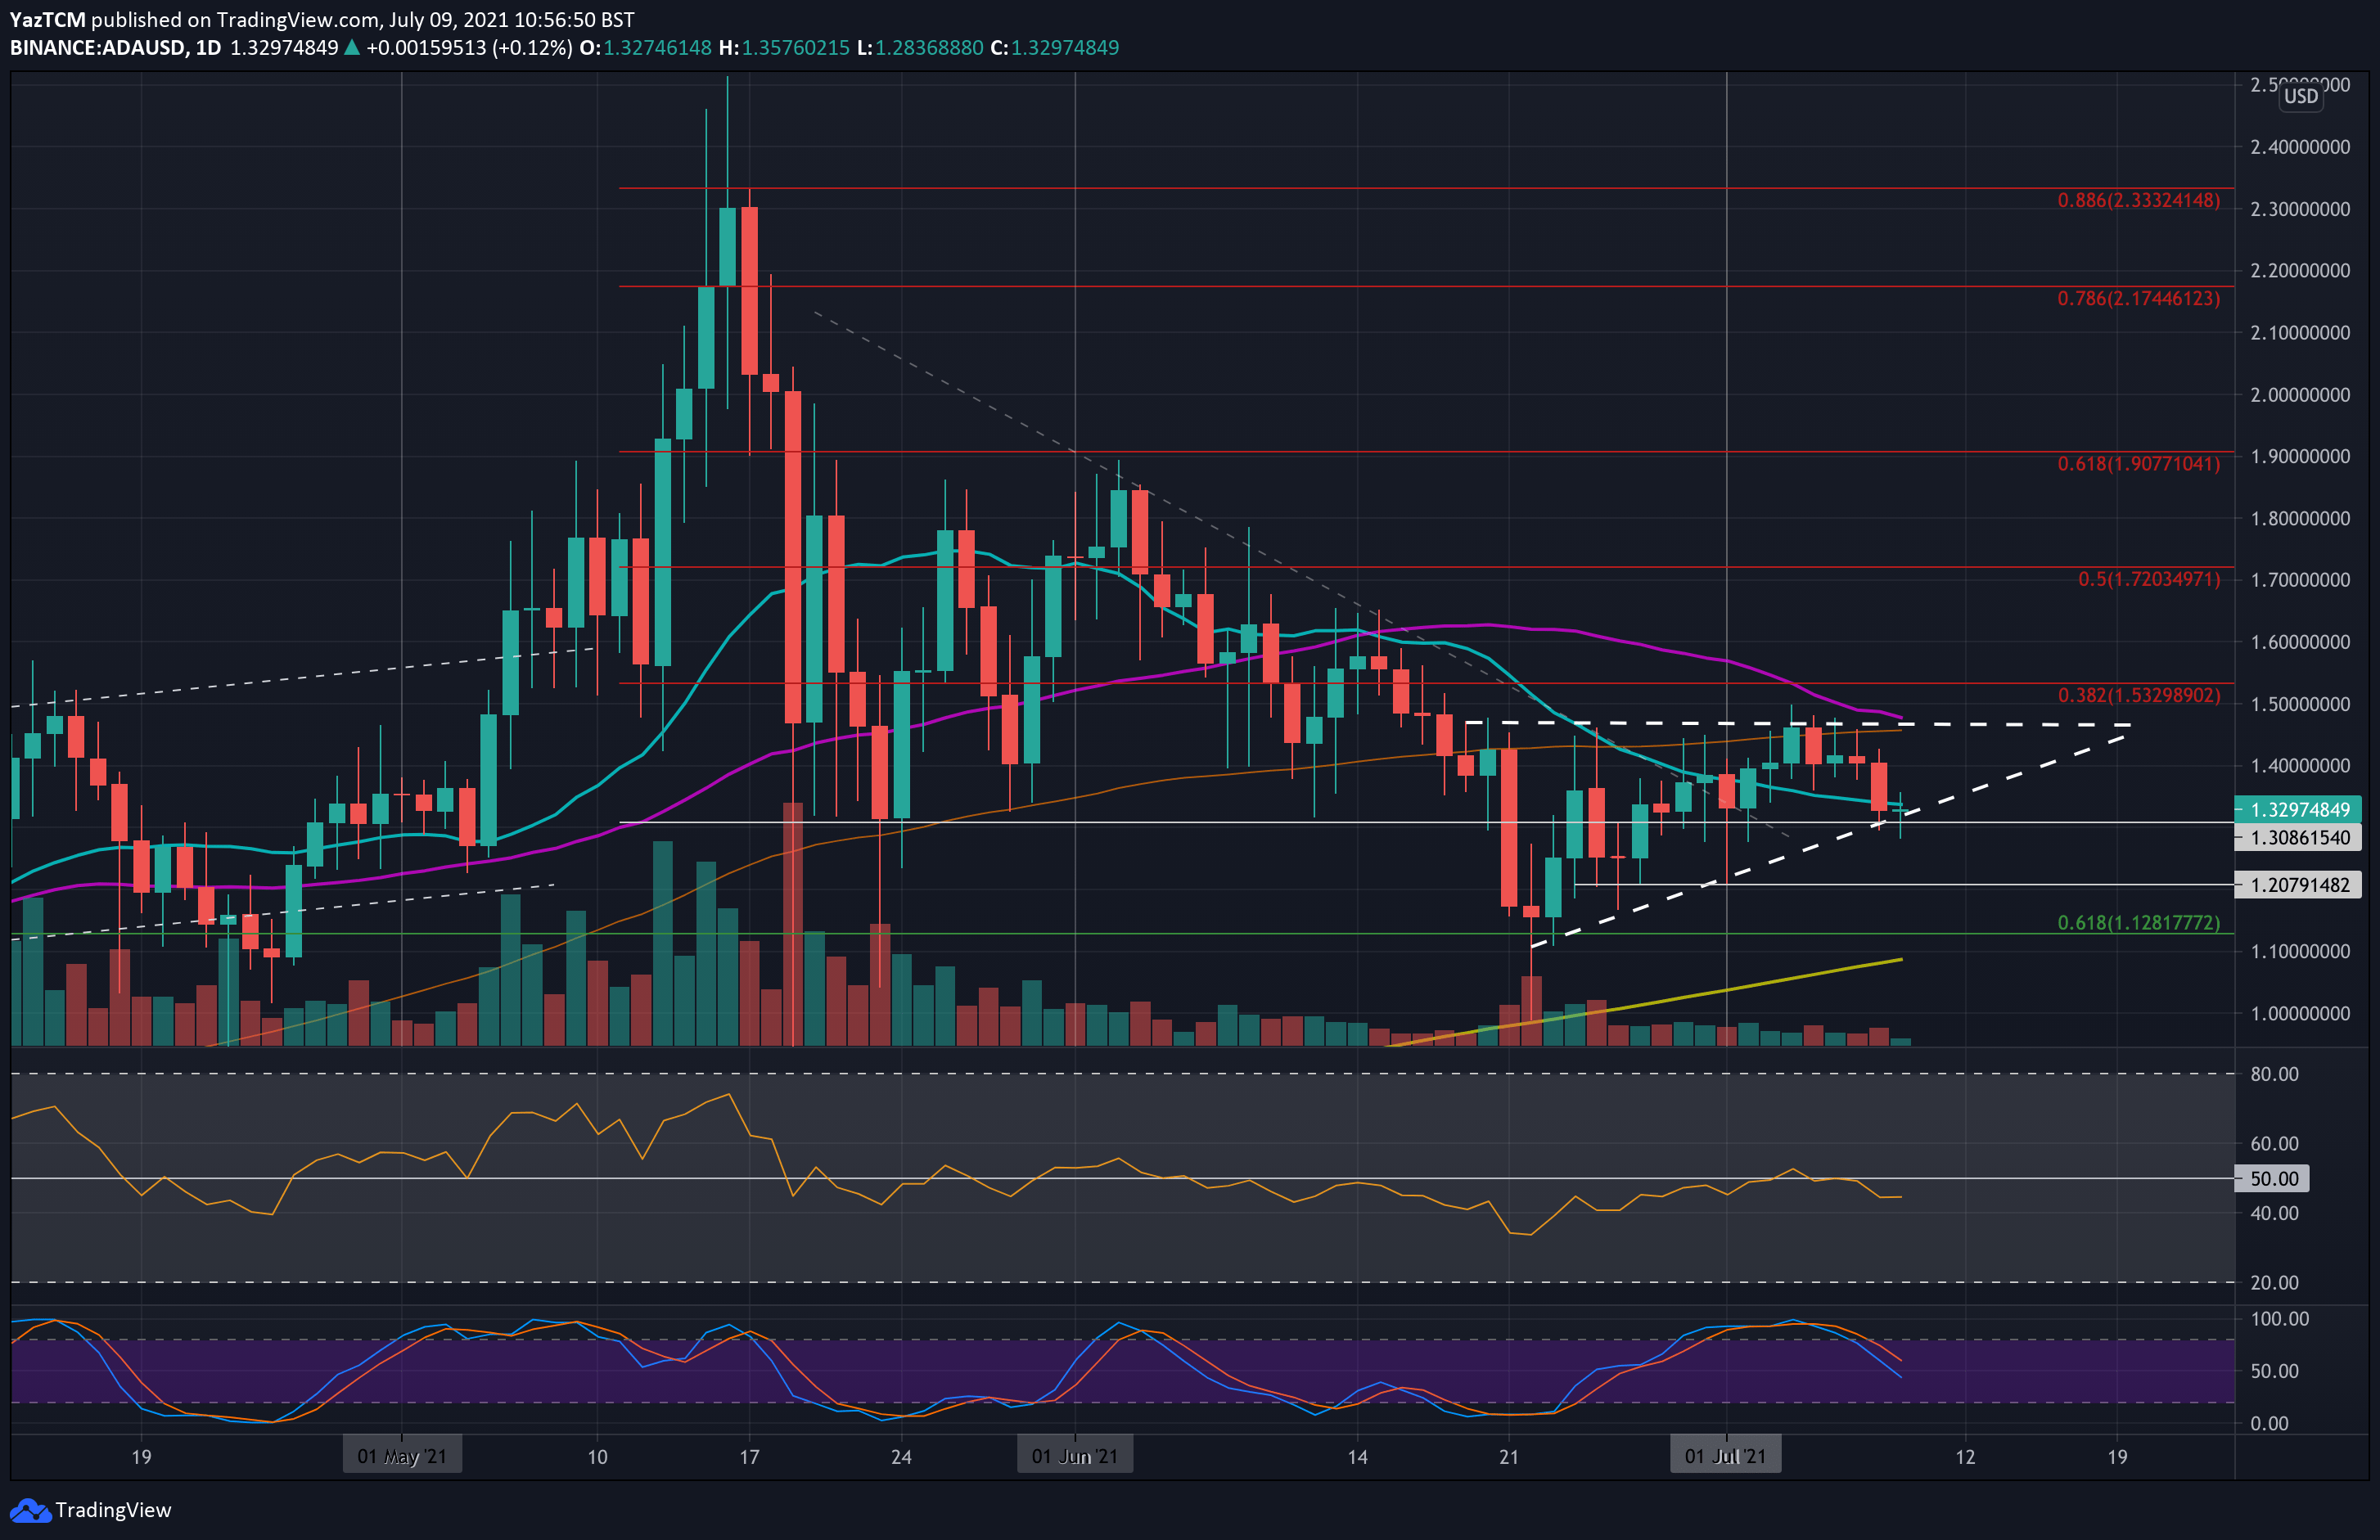
ADA/USD has remained stationary as it trades around $1.3, where it started the week. ADA has been trading inside an ascending triangle pattern and got rejected by the upper angle earlier this week (at around $1.48).
After multiple attempts to break the triangle, and following the sentiment, ADA broke down from $1.40, breaking beneath the 20-day MA line, to reach as low as $1.30. Today, the bulls are battling to maintain the triangle pattern at support provided by the lower angle.
Moving forward, the first support lies at $1.30 (lower angle of the triangle). This is followed by $1.25, $1.20, and $1.10 (200-day MA).
On the other side, the first resistance lies at $1.40. This is followed by the resistance between $1.46 (100-day MA) and $1.48 (50-day MA). Above $1.50, added resistance lies at $1.53 (bearish .382 FIb).
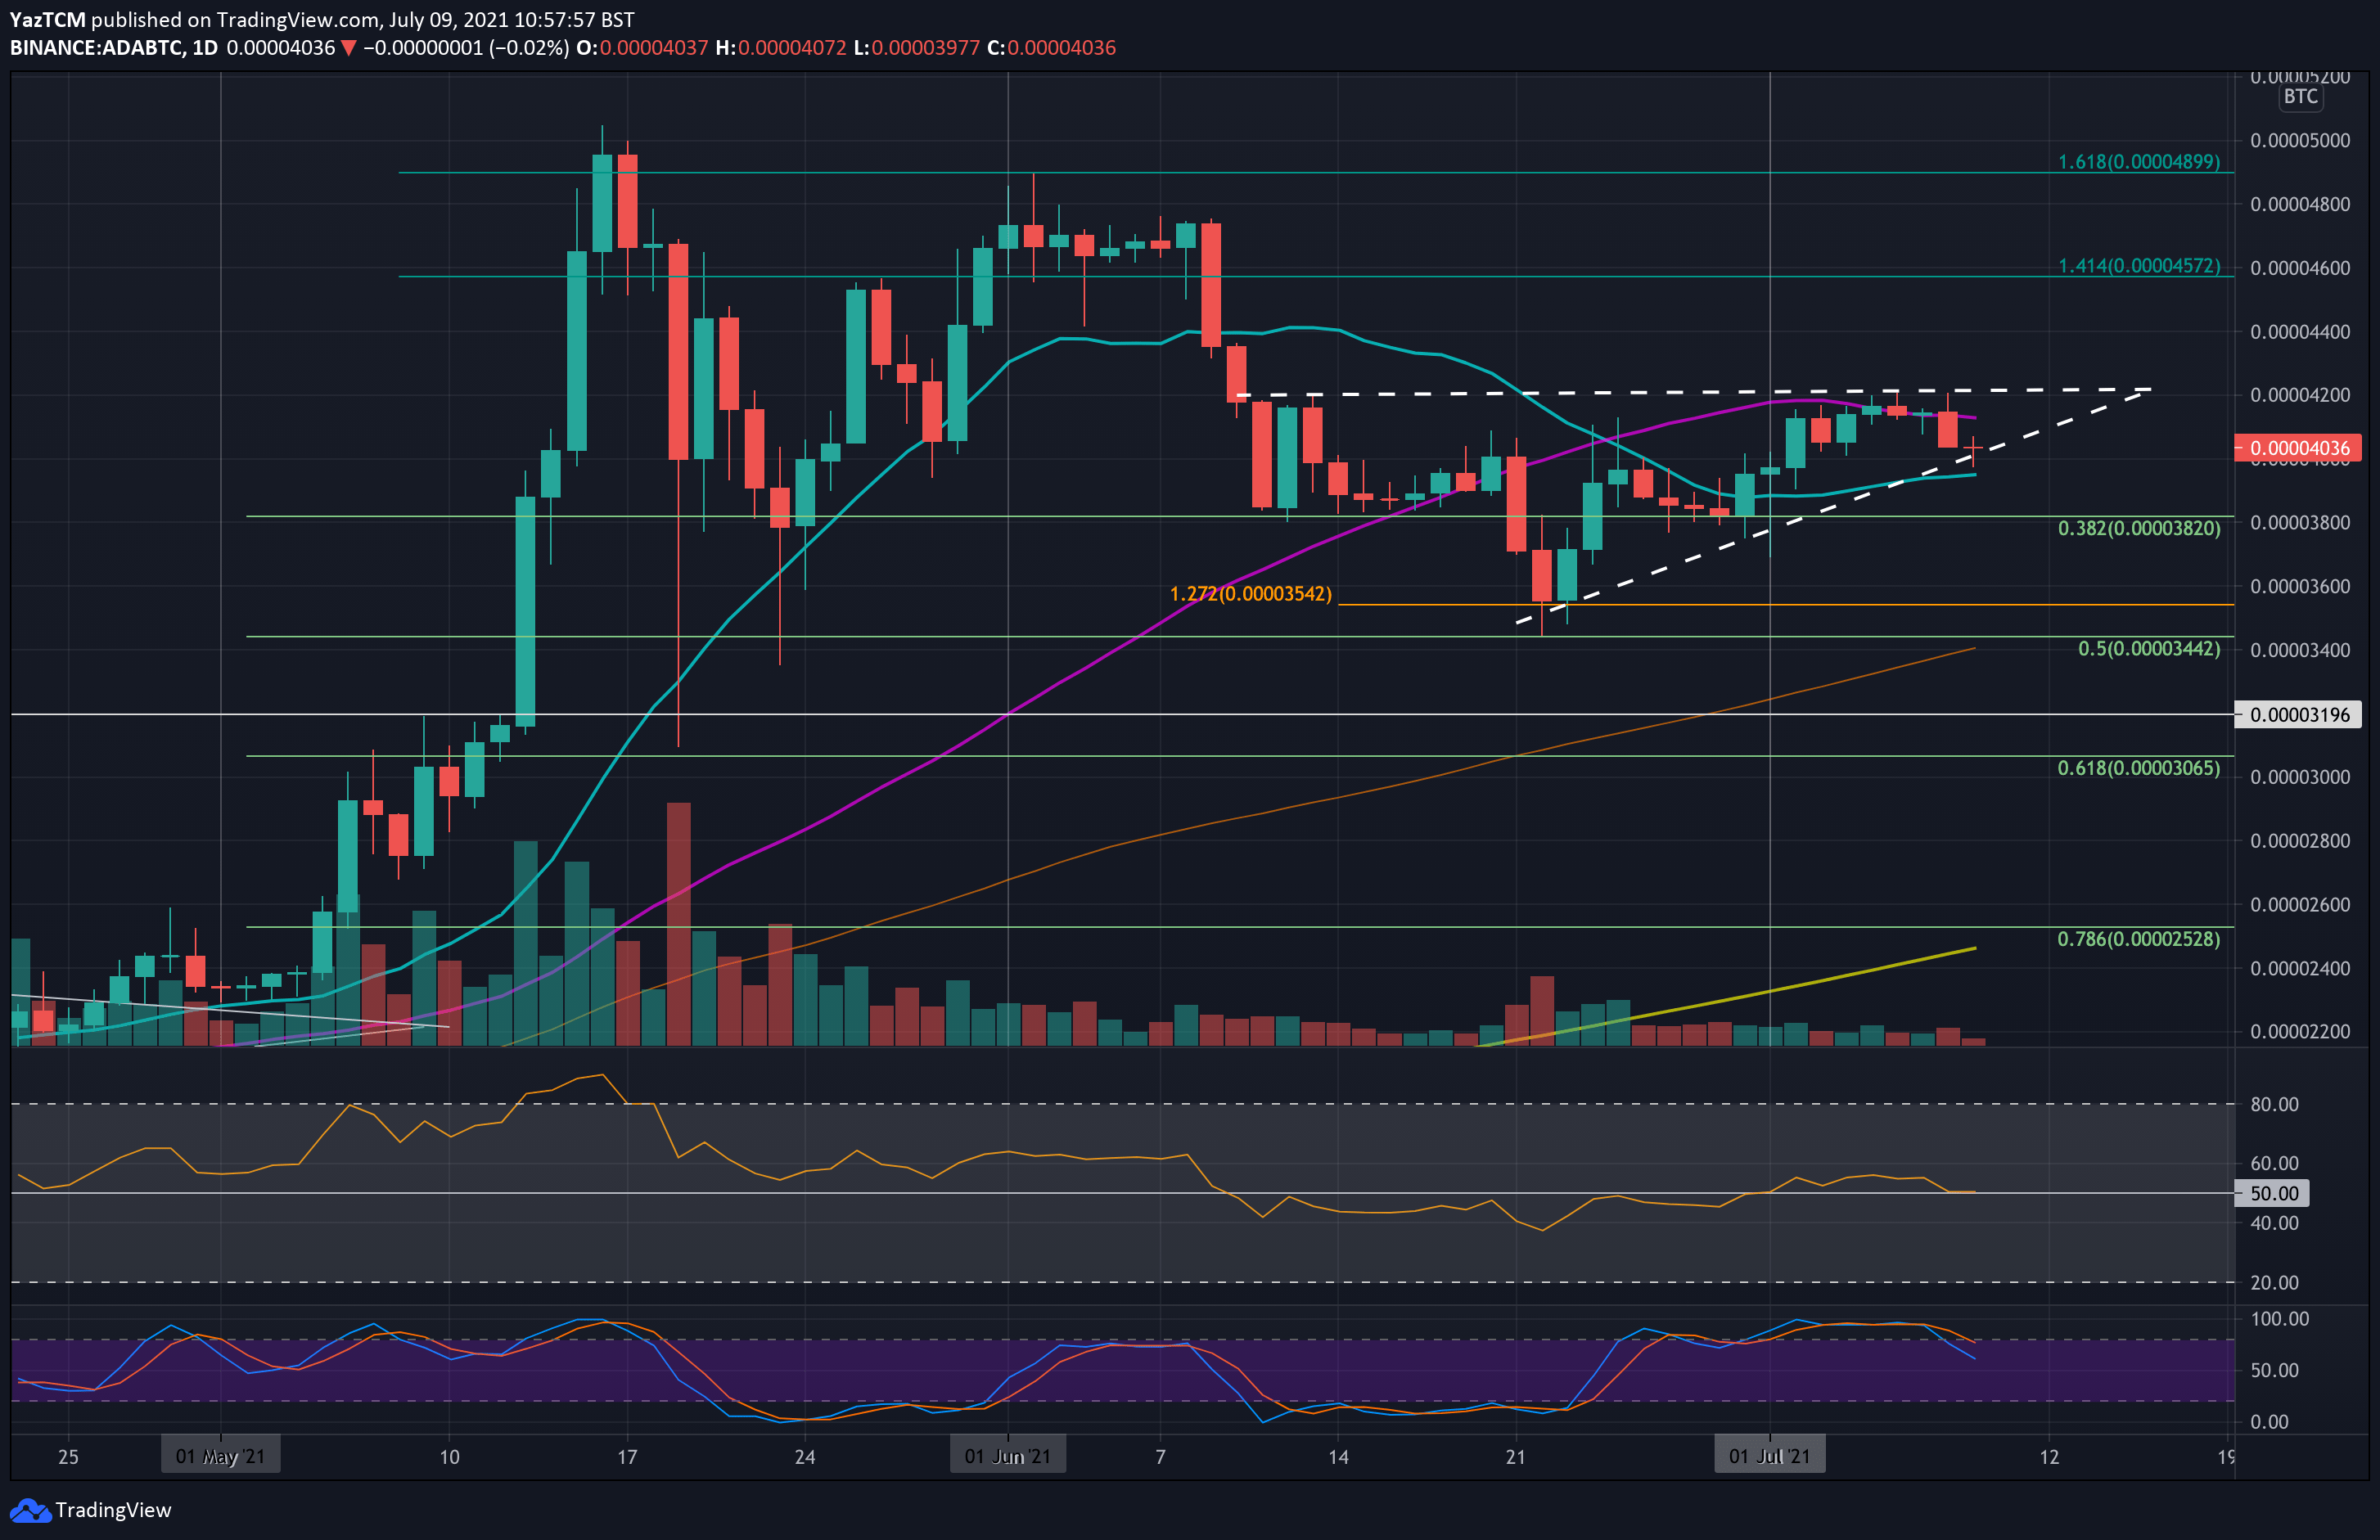
ADA is also trading inside an ascending triangle pattern against BTC. The coin tested the upper angle of this triangle at 4200 SAT throughout the week but failed to break above. ADA/BTC was also held back by resistance at the 50-day MA (~4150 SAT).
Yesterday, ADA dropped beneath the 50-day MA and continued lower into the 4000 SAT area, where it found support at the lower angle of the triangle.
Looking ahead, if the bears break the triangle and fall beneath 4000 SAT, the first support lies at 3950 SAT (20-day MA). This is followed by 3820 SAT (.382 Fib), 3540 SAT (downside 1.272 Fib Extension), and 3400 SAT (.5 Fib & 100-day MA).
On the other side, the first resistance lies at 4150 SAT (50-day MA). This is followed by 4200 SAT (triangle’s upper angle), 4400 SAT, and 4570 SAT (1.414 Fib Extension).
Solana
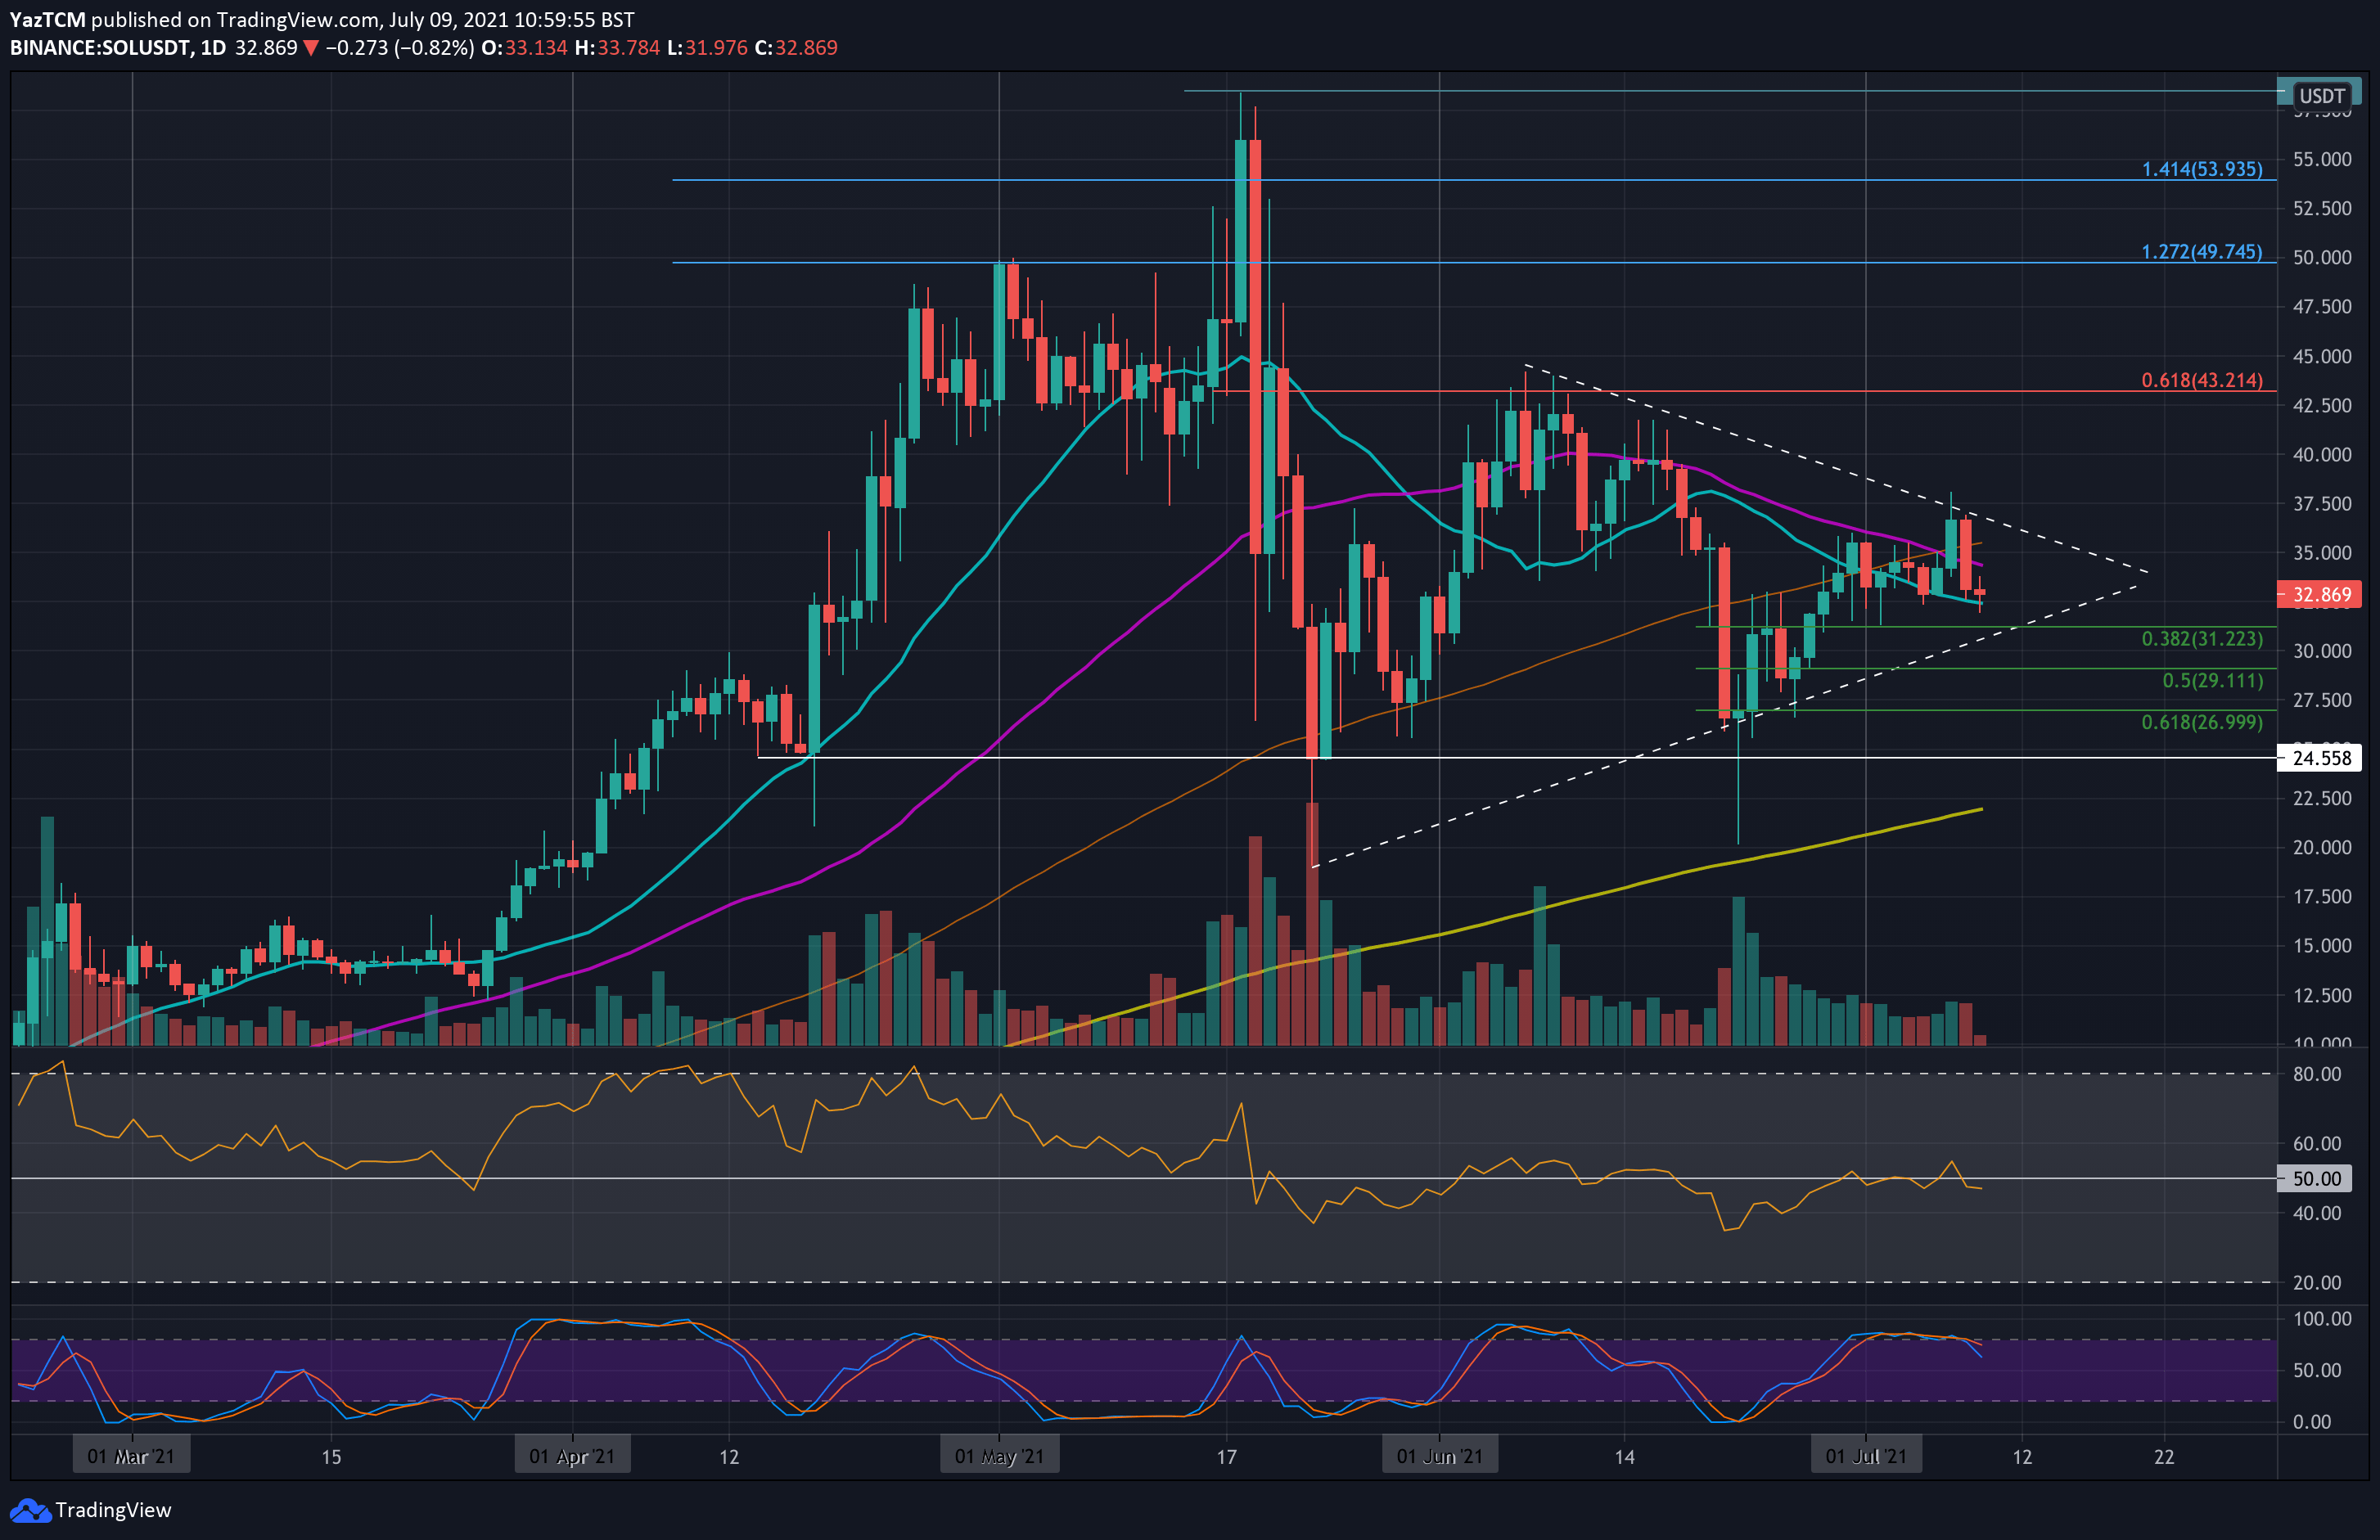
SOL saw a minor 2% price drop this week as it decreased into the 20-day MA zone. Since the end of June, SOL has been trading inside a symmetrical triangle and tested the upper angle at around $36.80 during this week.
Unfortunately, it could not break above and quickly got rejected to hit the 20-day MA today at $32.86.
Moving forward, the first support beneath the 20-day MA lies at $31.22 (.382 Fib & triangle’s lower angle). This is followed by $30, $29.11(.5 Fib), and $27 (.618 Fib).
On the other side, the first resistance lies at $34.40 (50-day MA). This is followed by $35.50 (100-day MA), the upper angle of the triangle, and $38.10 (weekly high).
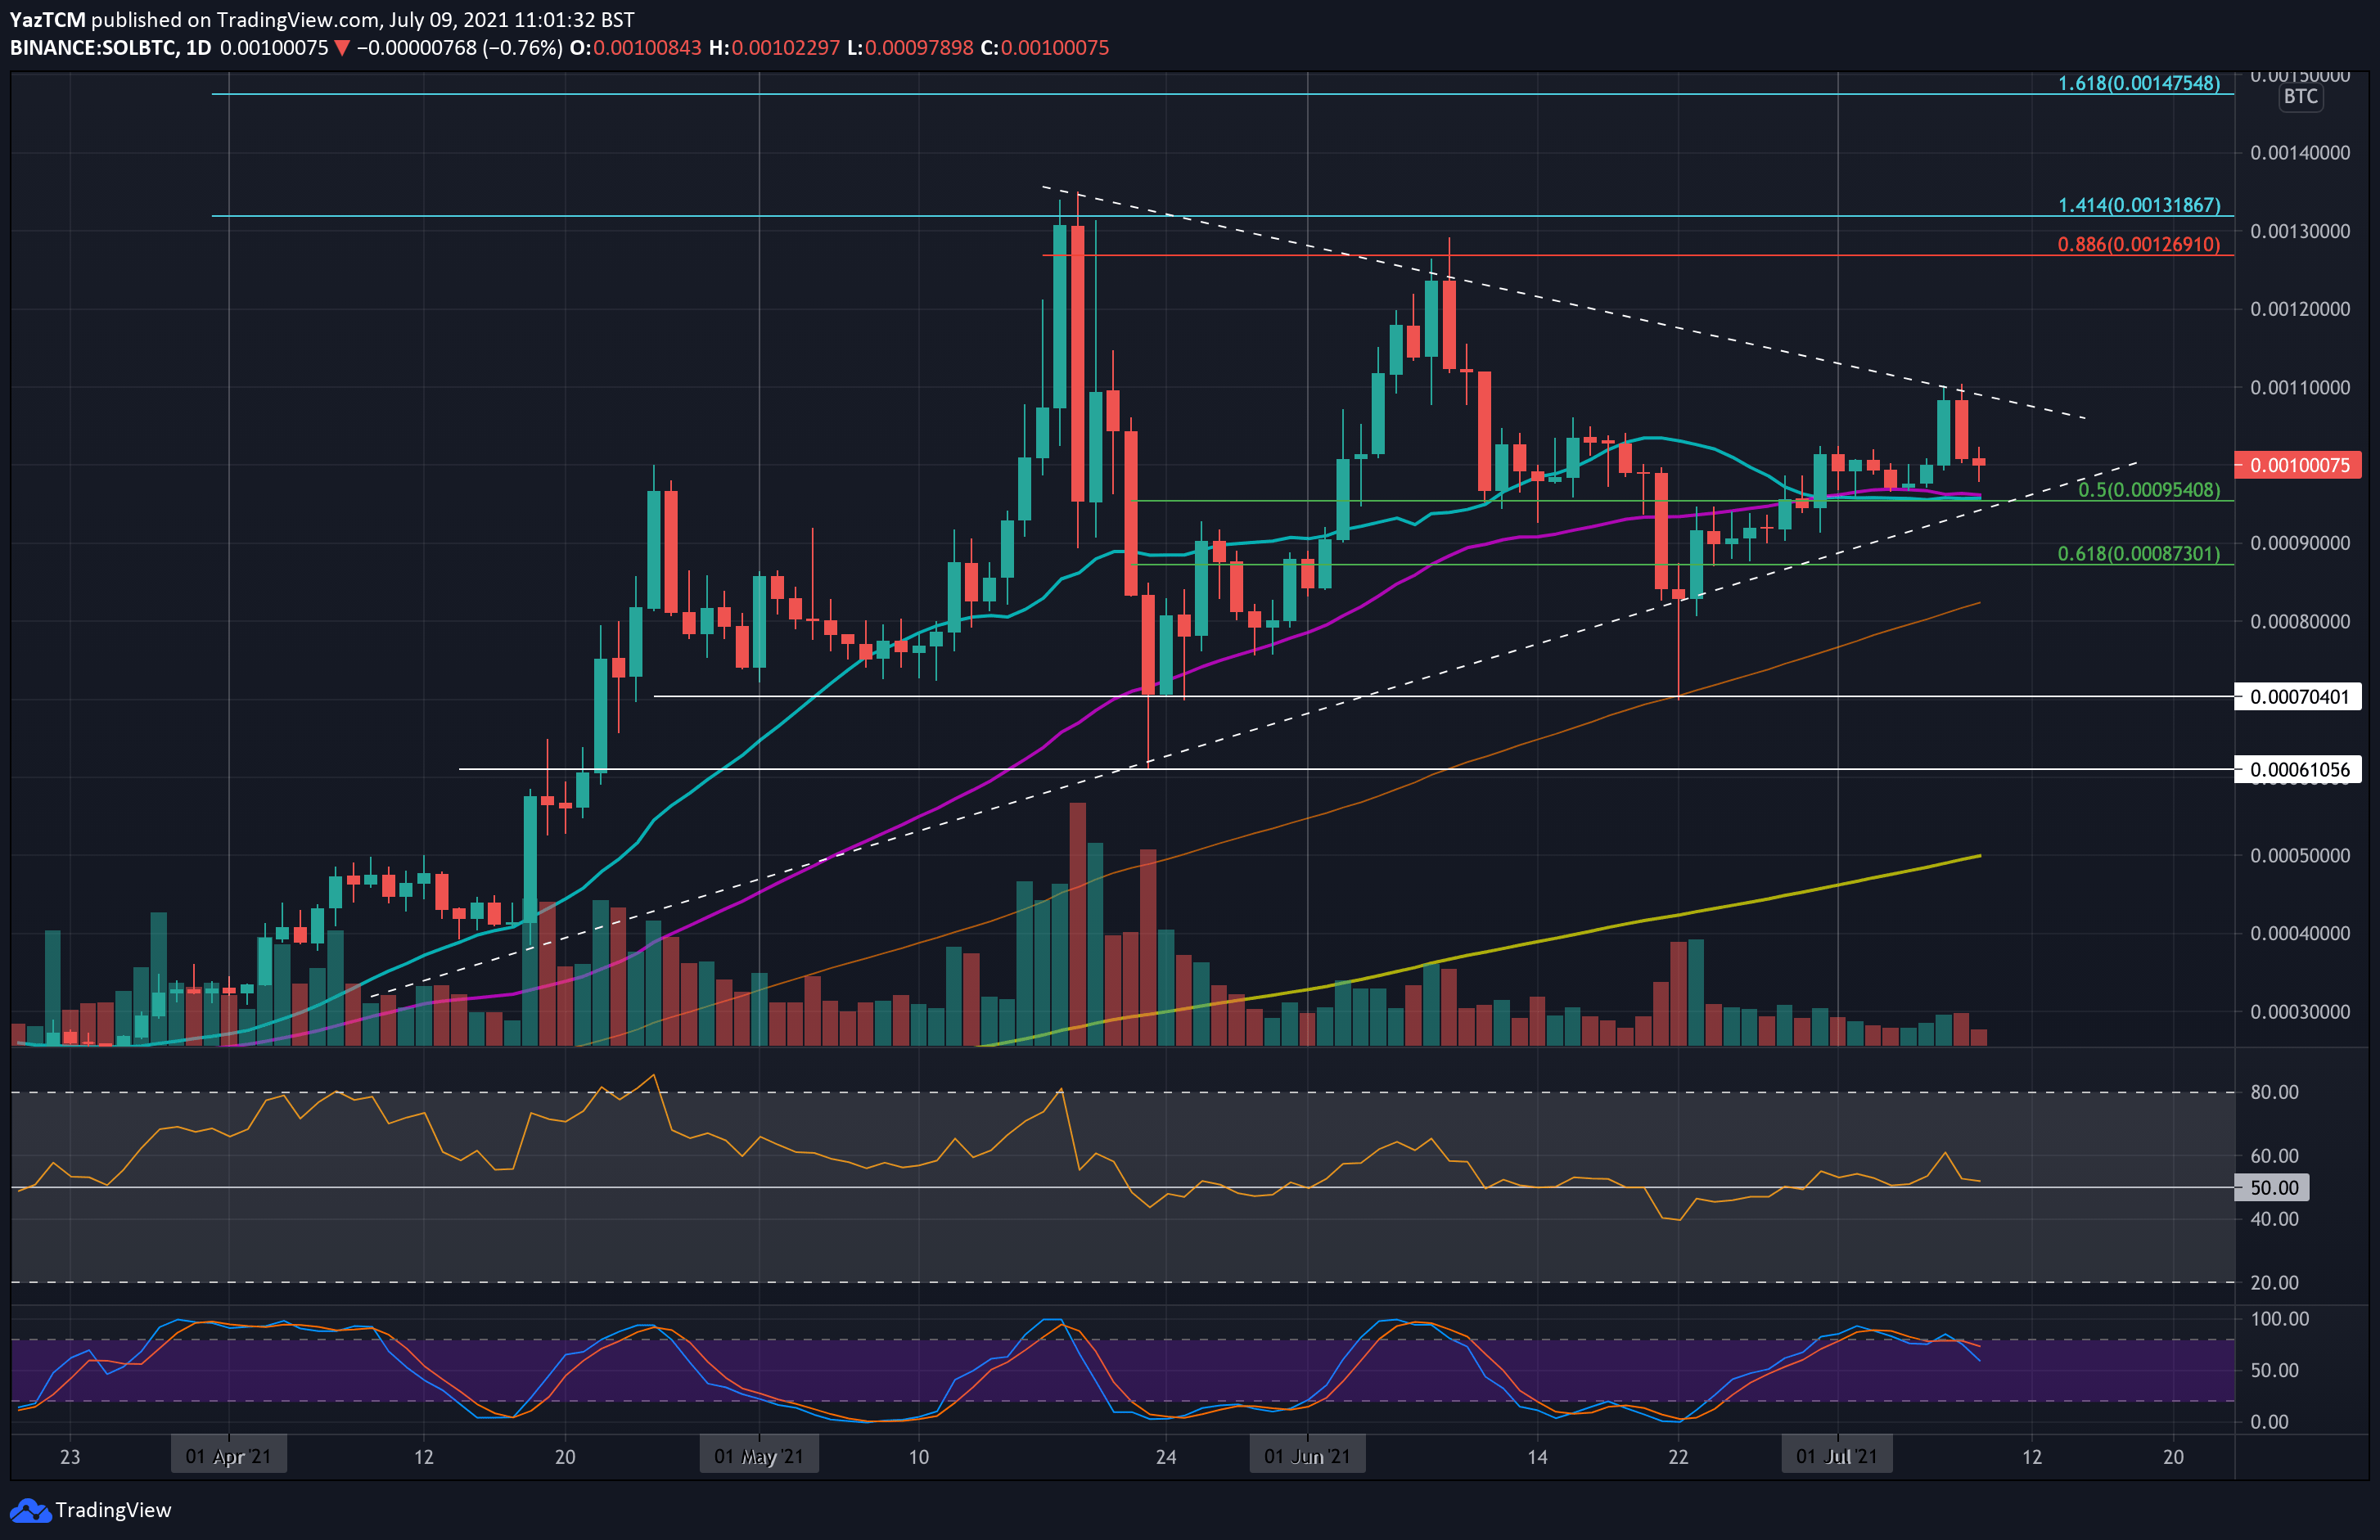
SOL/BTC has been trading inside a longer-term symmetrical triangle pattern since the end of May. It started the week by rebounding higher from support at 0.00095 BTC (20-day MA)., then attempted to push higher during the week but could not overcome resistance at the upper angle of the triangle at 0.0011 BTC.
SOL/BTC has since been rejected from there to hit 0.001 BTC earlier today.
Looking ahead, if the bears break 0.001 BTC, the first major support lies at 0.00095 BTC (.5 Fib, 20-day MA, 50-day MA, & lower angle of the triangle). This is followed by 0.0009 BTC, 0.000873 BTC (.618 Fib), and 0.000824 BTC (100-day MA).
On the other side, the first major resistance lies at 0.0011 BTC (triangle’s upper angle). This is followed by resistance at 0.0012 BTC, 0.00126 BTC, and 0.0013 BTC.
Disclaimer: Information found on CryptoPotato is those of writers quoted. It does not represent the opinions of CryptoPotato on whether to buy, sell, or hold any investments. You are advised to conduct your own research before making any investment decisions. Use provided information at your own risk. See Disclaimer for more information.
Cryptocurrency charts by TradingView.


