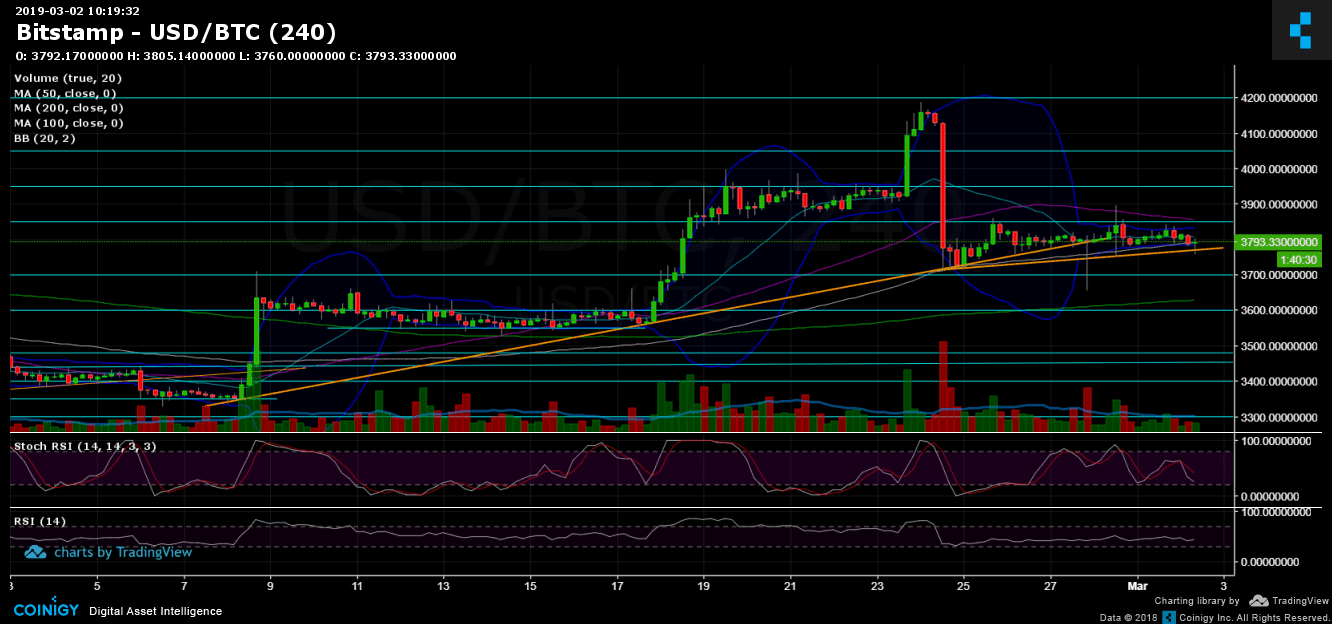
Since our recent BTC price analysis and for the past week, the coin had been trading around the $3800. The lower boundary lies at $3700 – $3750, while the upper edge lies at $3850 resistance.
As we already know, Bitcoin doesn’t like stability. Hence, we are expecting a major move to take place in the next 24 – 48 hours. This can be noted by the Bollinger Bands, which are at their tightest point for a long while.
The direction of the anticipated move we are expecting is still unknown. However, the momentum is in favor of the bears, as of now.
Total Market Cap: $129.8 Billion
BTC Dominance: 52.1%
– The formation of Bitcoin might seem like a bear flag. A breakdown, followed by decent sellers’ volume, could play out in the case of breaking $3750. The formation will get invalidated in case of breaking up the $3850 resistance mark.
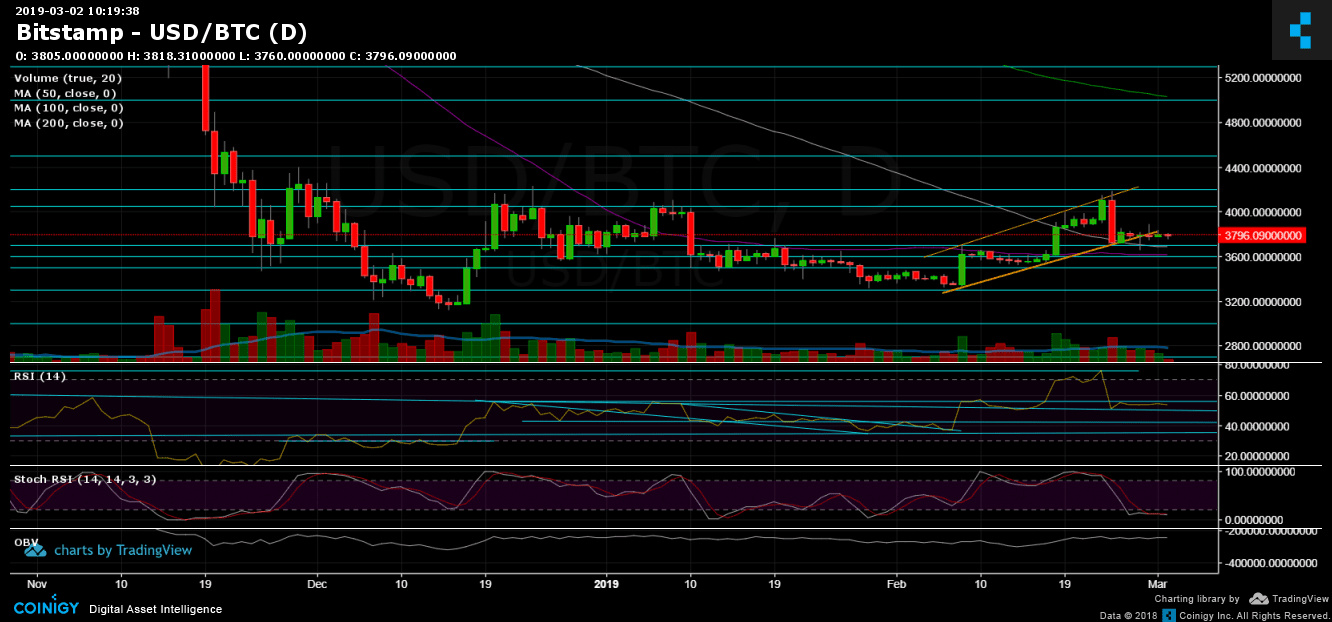
– Support/Resistance: The bigger picture hasn’t changed much for the past week, as we can see that, besides the ascending trend-line (at current BTC level), the next significant support level is at the $3750 level (marked in orange).
Below is the $3700 support level (along with the daily chart’s 100 days moving average line, marked in white). Further support lies at the $3600 mark (along with the 1-day’s chart significant 50-days moving average, marked in purple) and the famous $3480 – $3500 support area.
From the bull side, resistance levels at $3850 (along with the 4-hour 50-MA), $3900 and $4050.
– The daily chart’s RSI level: The Stochastic RSI Oscillator is about to cross over at the oversold area (for the past three days). In case this plays out, we can expect a bullish move which could break-up the significant $3850 resistance.
– The daily trading volume: The volume is decreasing from day to day over the past week. This also supports the option of an anticipated major move.
– BitFinex open short positions: The shorts are between the 19K BTC area from above, to the 17K from below. This is a fragile and dangerous spot.