

Not a lot has happened since our previous price analysis; Bitcoin is still consolidating around the $6400 mark. It seems like a decision is soon to take place; whether breaking up the long-term descending line tough resistance or else – towards the $6000 – $6100 (again).
Now what?
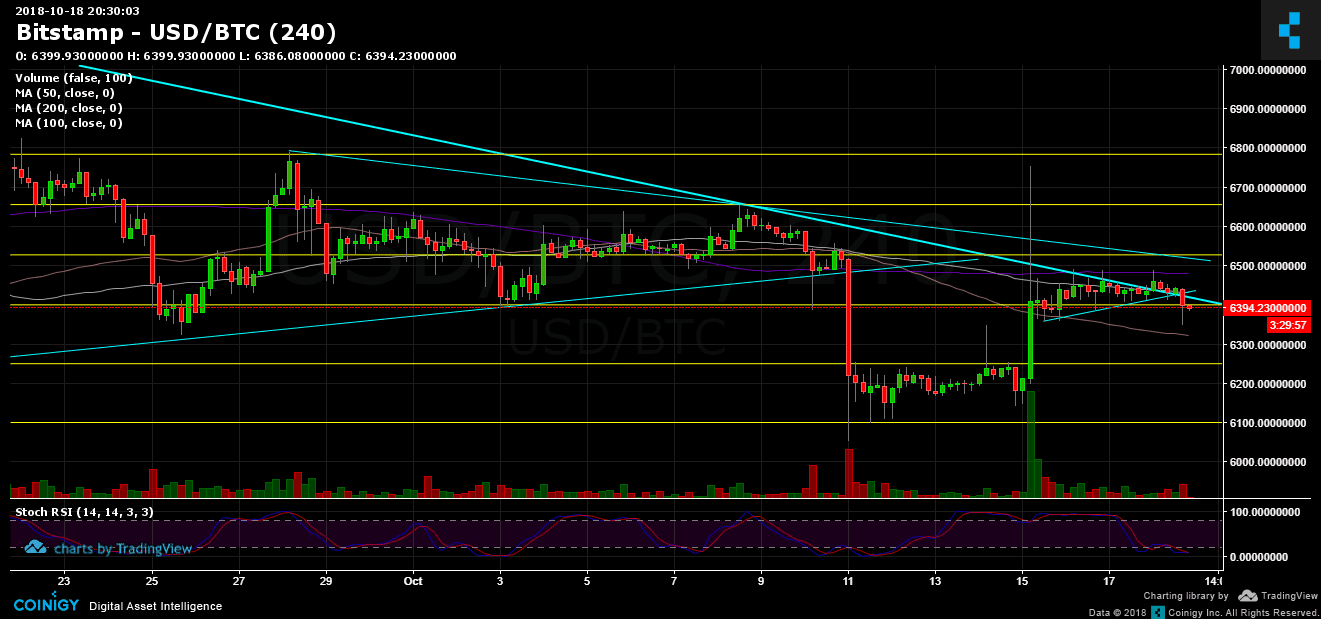
- Bitcoin is (still) testing the long-term descending trend-line, which started somewhere around March this year when Bitcoin’s price was about $11,700. This is a tough resistance area including the 200 and 100 days moving average lines (purple line represents the MA-200, white line represents MA-100). A possible break up could occur only followed by a decent amount of trading volume. As of now, the volume is pretty low.
- From below: support lies at current levels around $6400 (along with 50 days moving average line is now around $6320). Next support lies at $6250 and after is $6100.
- BitFinex short positions are continuing to accumulate. Getting close to the point before the Tether crash (followed by the short squeeze).
- RSI levels are at their LOW levels; Market is oversold as of now. This might give some hope to break up.
- As a reminder: The market is still bearish. I would change my mind, if and only Bitcoin will create a higher-low and breaking above $6800.
BTC/USD BitStamp 4 Hours chart
 Cryptocurrency charts by TradingView. Technical analysis tools by Coinigy.
Disclaimer: Information found on CryptoPotato is those of writers quoted. It does not represent the opinions of CryptoPotato on whether to buy, sell, or hold any investments. You are advised to conduct your own research before making any investment decisions. Use provided information at your own risk. See Disclaimer for more information.


