

Bitcoin dropped by a sharp 3% today as the cryptocurrency falls to the current $55,000 level. It attempted to break above $60,000 over the weekend but it failed to close a daily candle above $58,355. As a result, BTC slipped from $58,300 yesterday and fell beneath the March ascending trend line to reach as low as $53,700. It rebounded by the end of the day to close the candle at $54,000.
Earlier today, Bitcoin spiked further lower to reach as low as $52,930. Luckily, it found solid short-term support at $54,000, best seen on the 4-Hour charts, and bounced higher from there to climb back above $55,000.
This recent breakdown for BTC might set a short-term bearish trajectory for the coin as it starts to make fresh 2-weeks low.
BTC Price Support and Resistance Levels to Watch
Key Support Levels: $52,000, $52,000, $51,500, $50,700, $50,000.
Key Resistance Levels: $55,000, $58,350, $60,000, $61,780, $62,900.
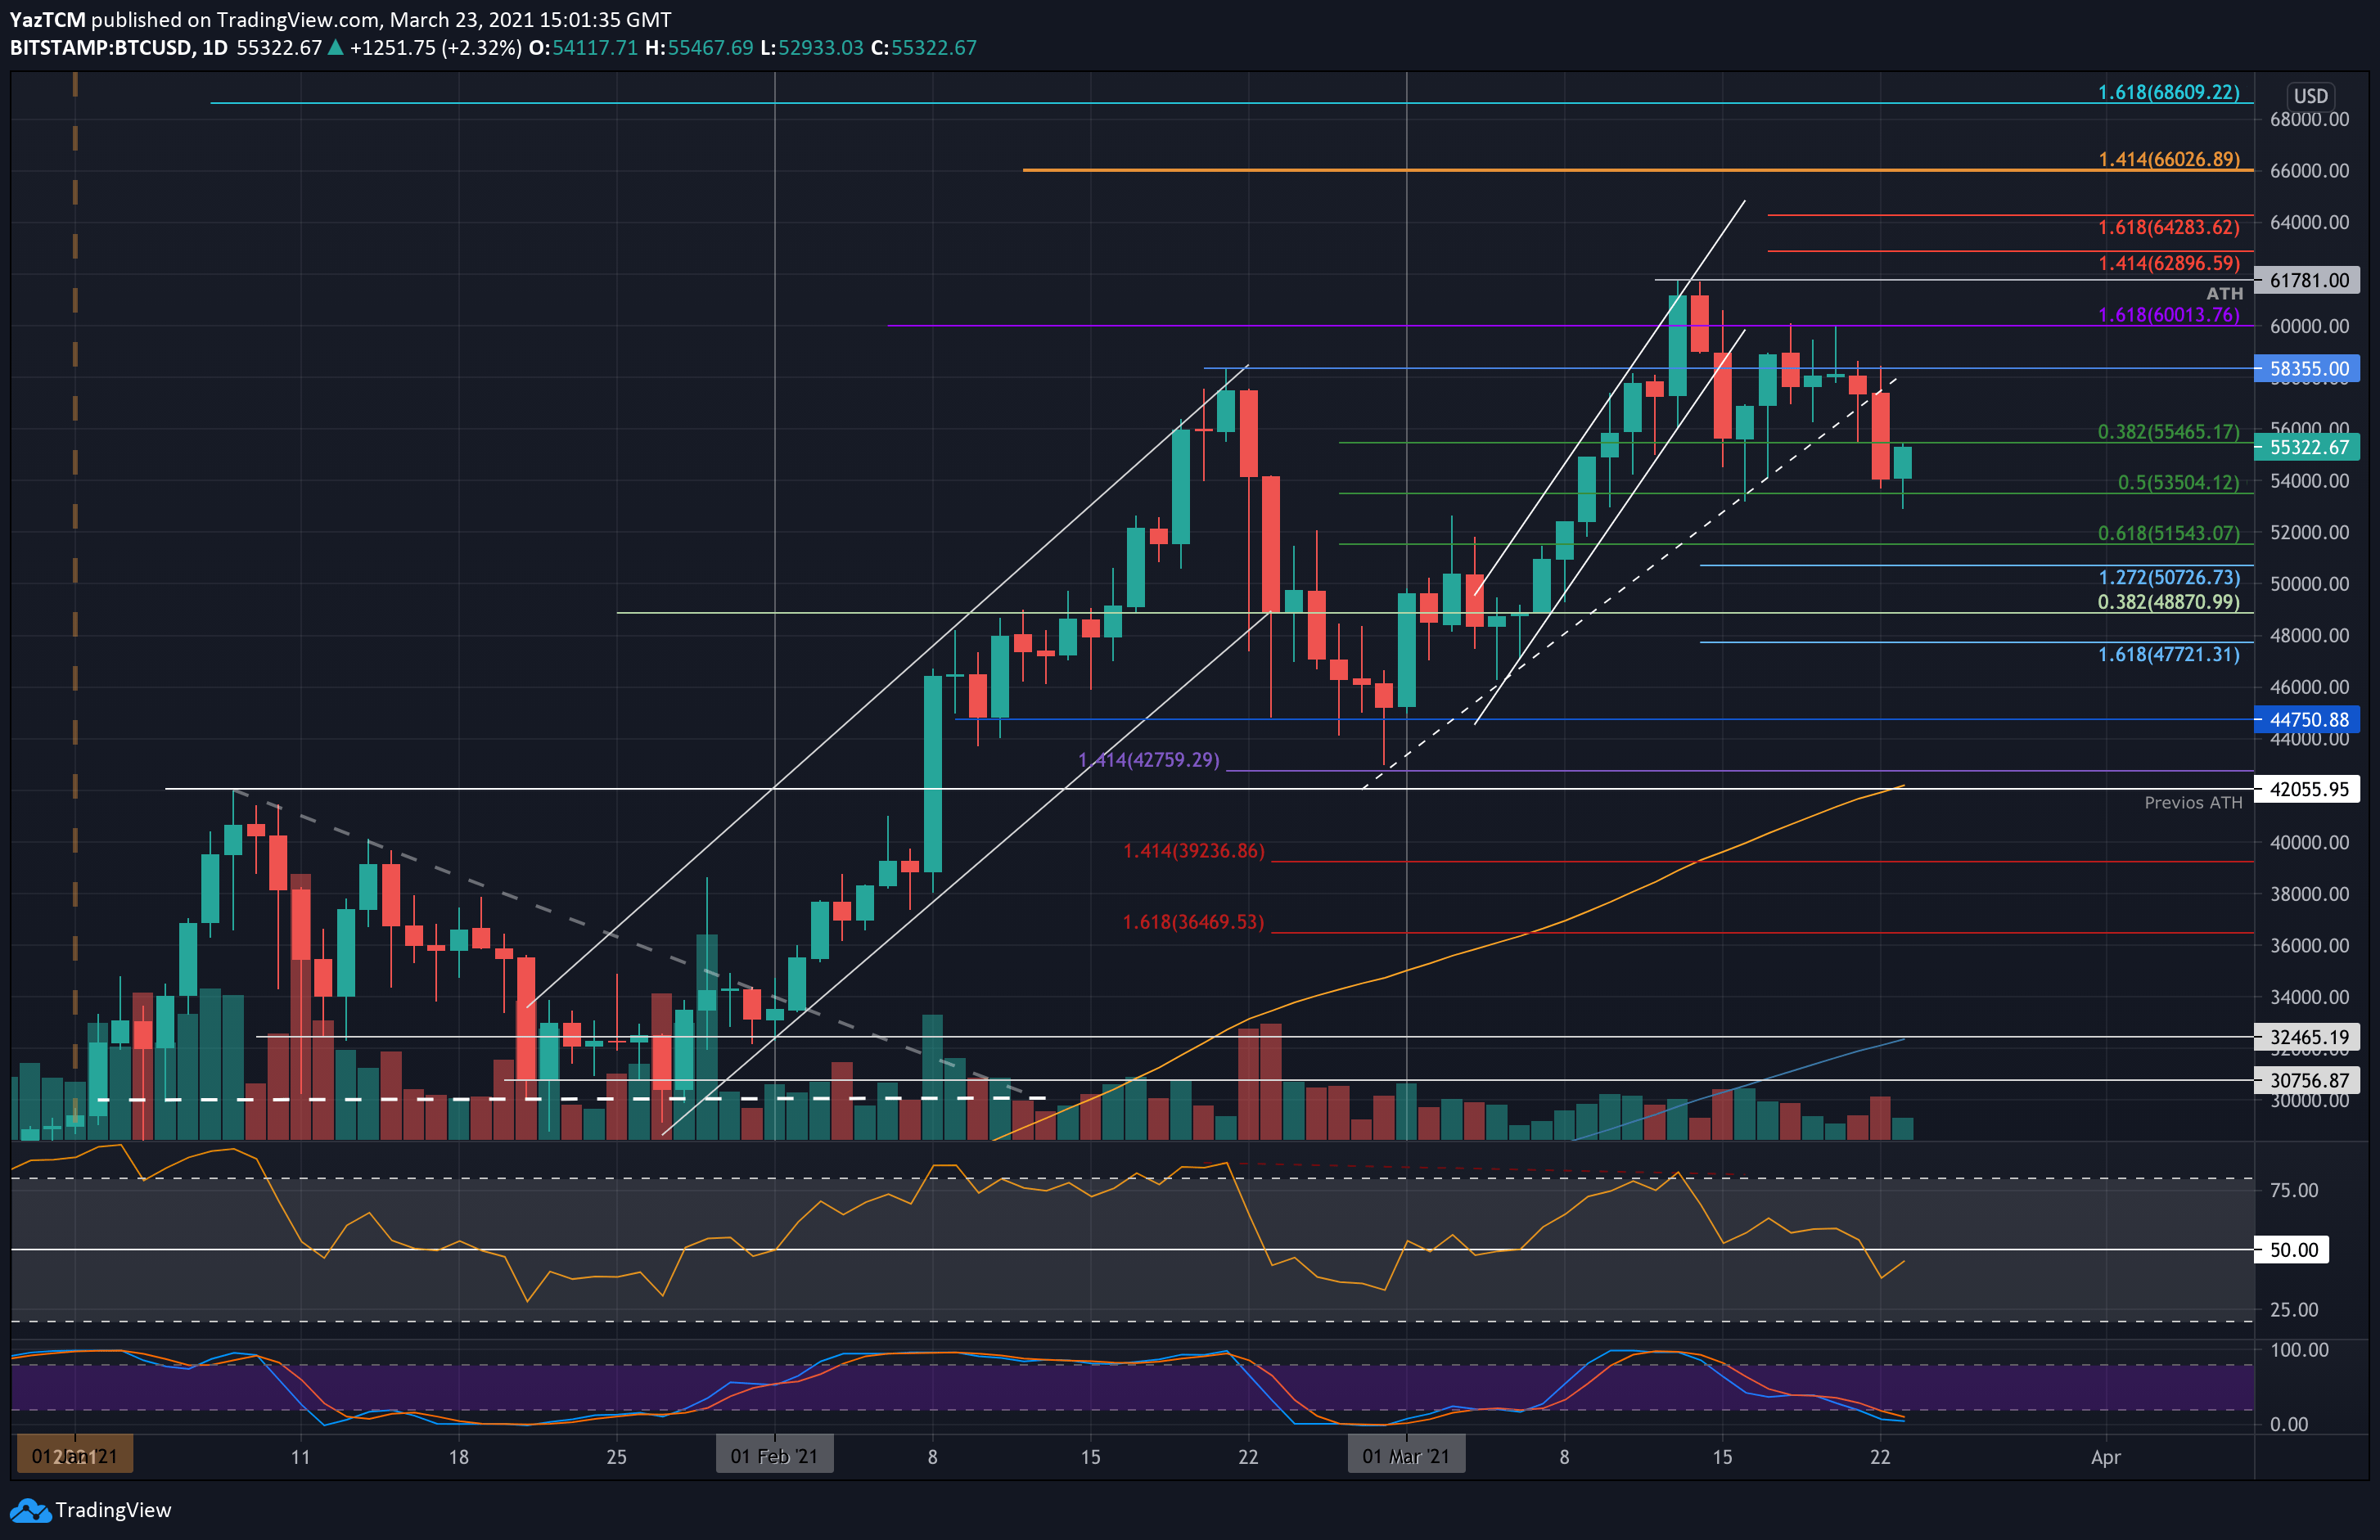
Looking ahead, the first level of support lies at $54,000. This is followed by support at $52,000, $51,500 (.618 Fib), $50,700 (downside 1.272 Fib Extension), and $50,000.
On the other side, the first resistance lies at $55,500. This is followed by $58,350, $60,000 (1.618 Fib Extension), $61,780 (ATH), and $62,900 (1.414 Fib Extension – red).
The RSI has now plunged beneath the midline, indicating short-term bearish momentum within the market. If it continues to drop, the increased bearish momentum will likely drag Bitcoin back toward $50,000.
Luckily, the Stochastic RSI is already extremely oversold, and a bullish crossover signal should help to stall the downtrend.
Bitstamp BTC/USD Daily Chart
Bitstamp BTC/USD 4-Hour Chart

Disclaimer: Information found on CryptoPotato is those of writers quoted. It does not represent the opinions of CryptoPotato on whether to buy, sell, or hold any investments. You are advised to conduct your own research before making any investment decisions. Use provided information at your own risk. See Disclaimer for more information.
Cryptocurrency charts by TradingView.


