After capturing a new annual low, Bitcoin was consolidating for around 12 hours before reaching to lower areas and marking the $3200 zone as the new yearly low.
This was followed by a new record of the open short positions on Bitfinex. We mentioned it in our yesterday’s article, along with the possibility for a short squeeze.
As anticipated, not long afterward, a nice short squeeze had occurred sending Bitcoin for nice 10% gains, reaching a high of $3530 on Bitstamp (this resistance area include the top of the wedge formation, along with the 50 days moving average line).
As a reminder from yesterday:
“The hourly chart movement reveals a wedge pattern. $3300 is the bottom line of it. In the above correction, I can only assume Bitcoin will meet with the upper line of the wedge around $3500. “
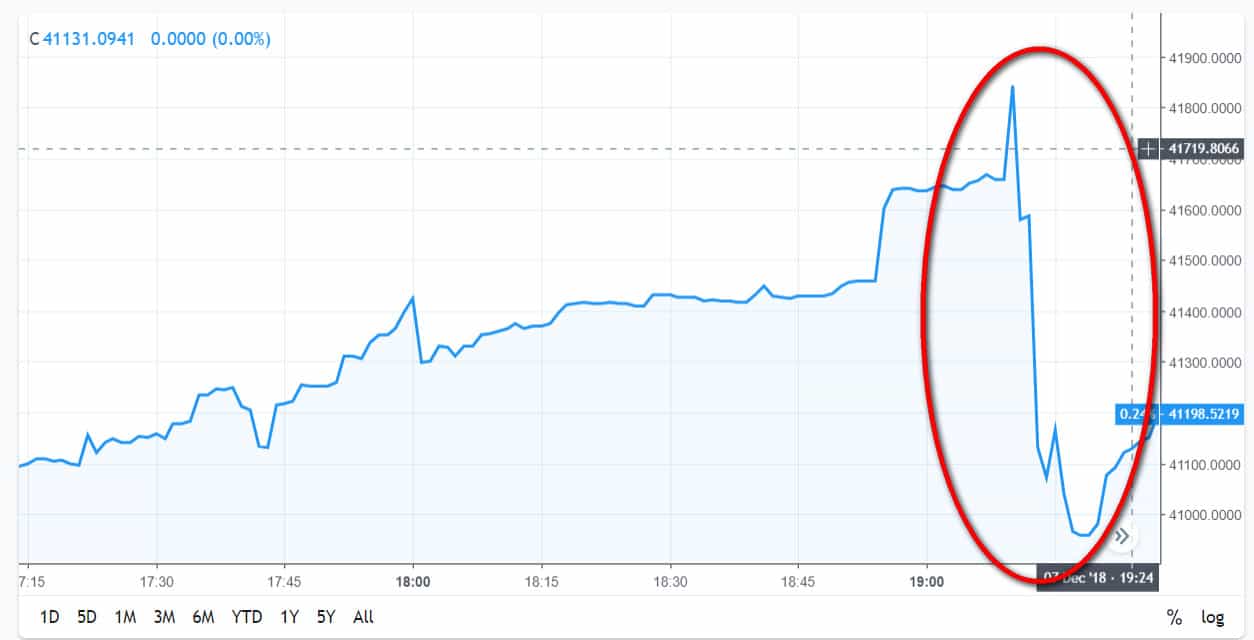
In the following chart, you can get a little idea of an effect of a short squeeze – 2% of the open positions were forced to close in trade for 10% gain in just a couple of minutes. Imagine what will happen when 20% of the positions would get liquidated at once.
Short Squeeze
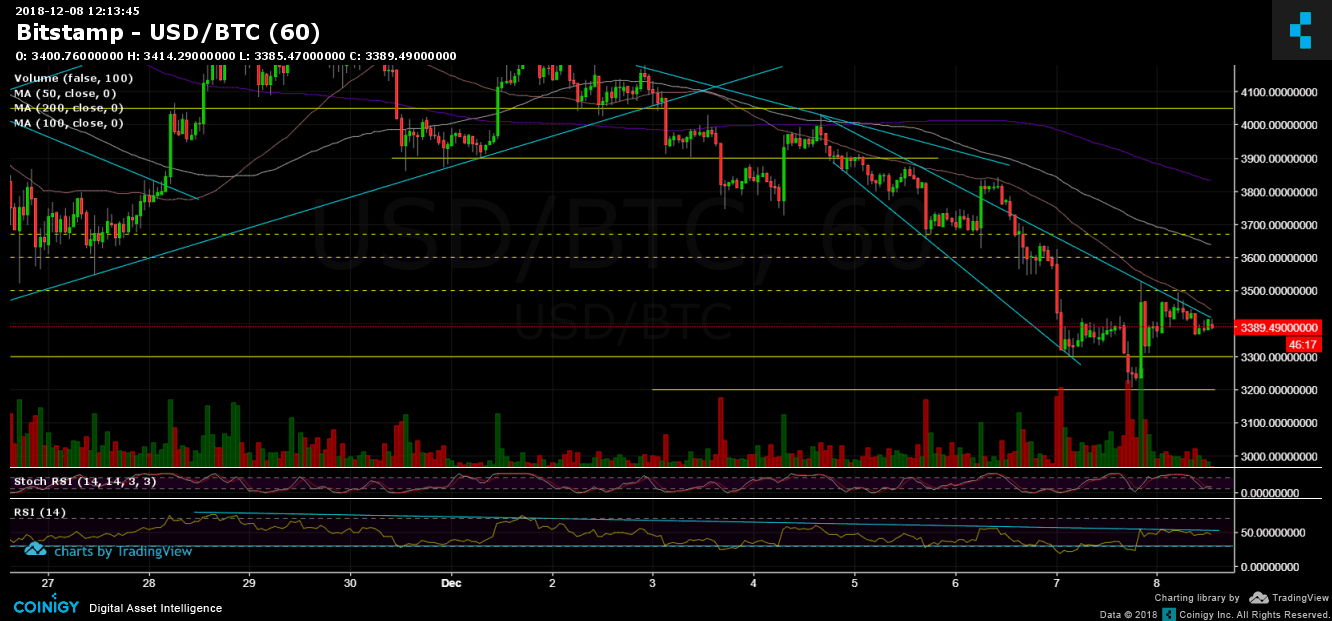
Looking at the 1-day & 1-hour charts
The short-term’s wedge pattern is still active. During the recent hours, Bitcoin is consolidating underneath the upper trend-line of the wedge, as can be seen on the following 1-hour chart.
The 1-Hour chart’s RSI: As mentioned before, the RSI is forming a bearish triangle pattern. As of now, the RSI level is at 50, touching the descending trend-line from below, while the base of the triangle is the significant 30 RSI level. Breakout of the triangle is likely to produce a move towards the breakout’s direction.
Critical support and resistance levels:
From the bull side – 50 days moving average line along with the descending trend-line (of the wedge). $3500, $3600 (resistance level along with 100 days moving average line), $3850 (a strong resistance level, prior high).
From the bear side: $3300, $3200, $3000, $2900, $2700.
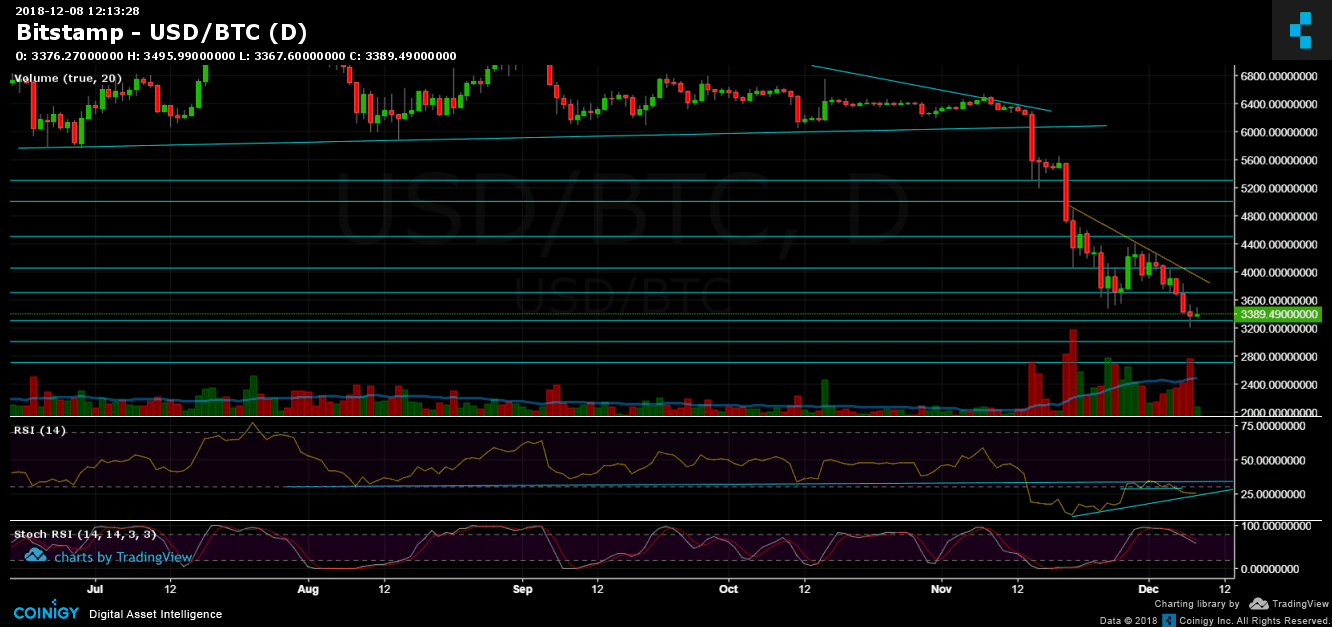
The daily chart RSI: After losing support at 28.5 RSI level, the RSI is nearing the ascending trend-line, where it found support twice before. A third-time reversal might produce a short-term bullish correction.
As mentioned above, BitFinex’s open short positions have reached a new all-time high, and currently stand around 42,700 BTC of open positions.
Binance Free $600 (CryptoPotato Exclusive): Use this link to register new account and receive $600 exclusive welcome offer on Binance (full details).
LIMITED OFFER 2024 for CryptoPotato readers at Bybit: Use this link to register and open a $500 BTC-USDT position on Bybit Exchange for free!
Disclaimer: Information found on CryptoPotato is those of writers quoted. It does not represent the opinions of CryptoPotato on whether to buy, sell, or hold any investments. You are advised to conduct your own research before making any investment decisions. Use provided information at your own risk. See Disclaimer for more information.
Yuval Gov has over 15 years of trading experience in the stock exchange, graduated from TAU - Economics and Management. Fell in love with the crypto space. Does Crossfit to get away from FOMO. Contact Yuval: LinkedIn