Ethereum’s price has been encountering resistance in breaking below the critical $3K support region, leading to slight fluctuations within a narrow and pivotal range. However, there is anticipation of a renewed bullish surge in the mid-term, driven by emerging demand.
By Shayan
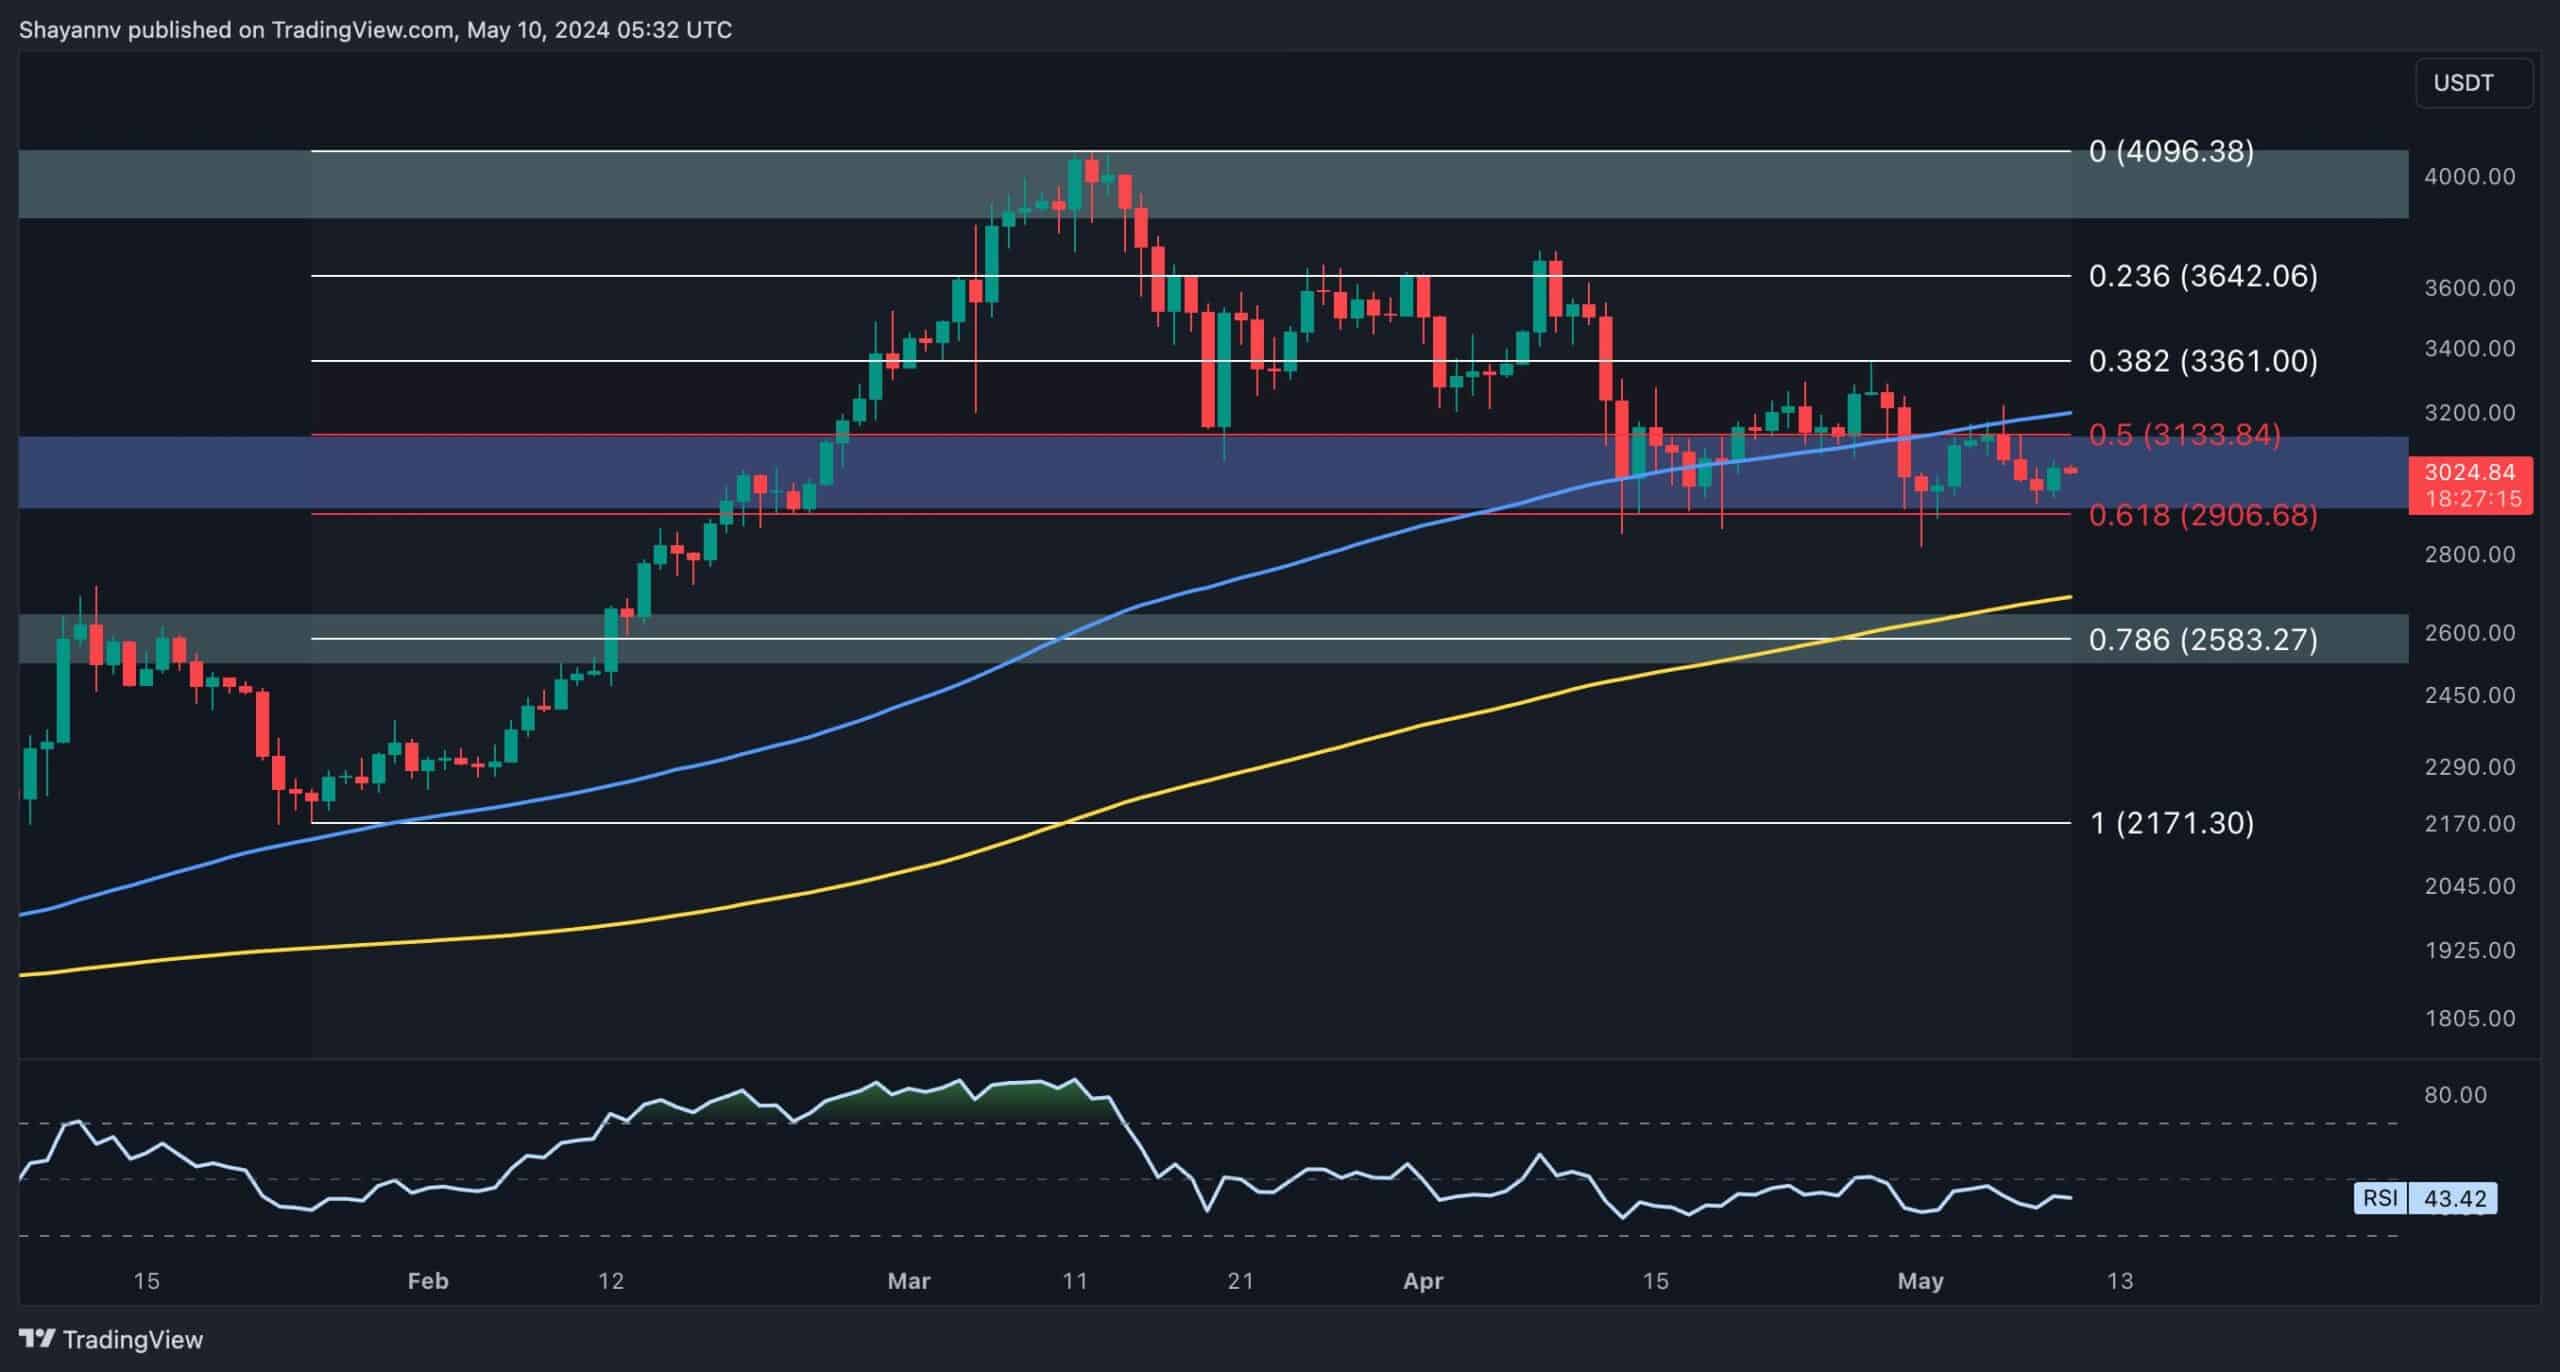
Upon analysis of the daily chart, Ethereum has been struggling to breach the crucial $3K support region, with the price confined within a tight range.
This significant range is delineated by the 0.5 ($3133) and 0.618 ($2906) Fibonacci levels, coinciding closely with the critical 100-day moving average. This alignment suggests substantial demand around this pivotal threshold.
Recent price action indicates a potential uptick in demand, signaling the possibility of a strong bullish rebound. However, a sudden breach of this critical support zone could trigger a cascade effect, with the next support target at the $2.5K region and the 200-day moving average at $2.6K.
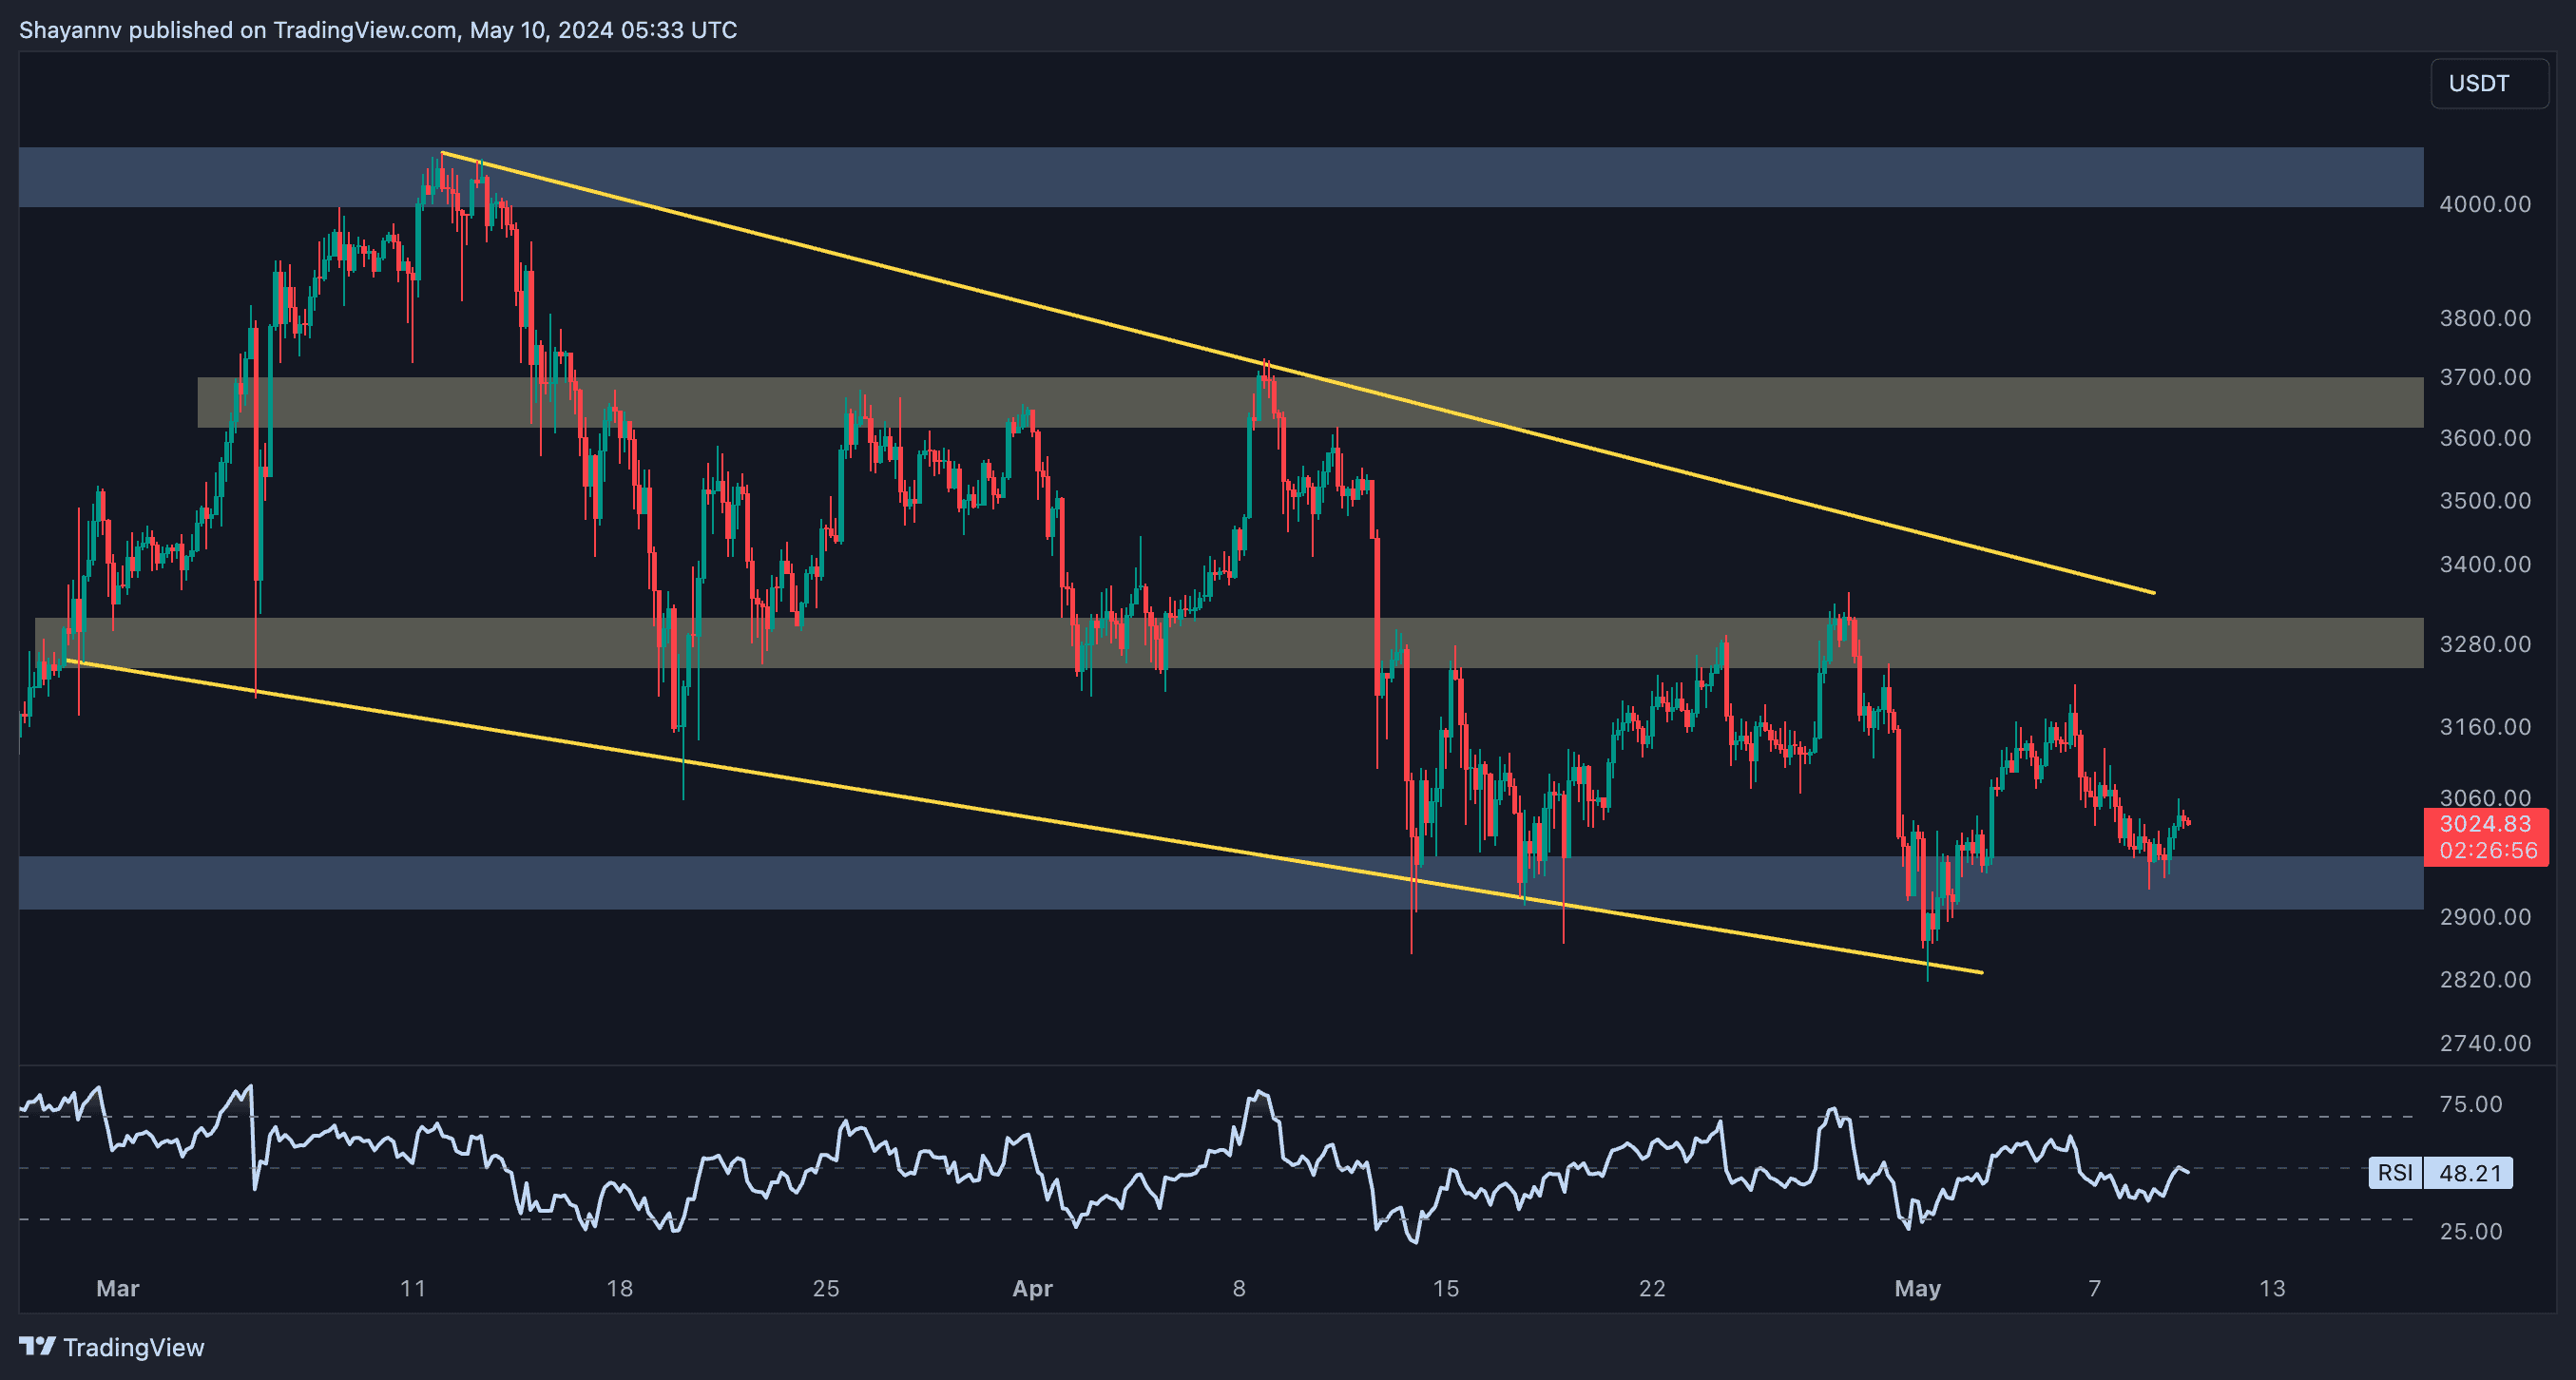
A closer examination of the 4-hour chart reveals a multi-week range-bound phase, with Ethereum consolidating between the significant support of $3K and the critical resistance at $3.2K.
Presently, the price is exhibiting sideways movement within this range, retracing toward the lower boundary corresponding to the $3K support region. This indicates a tug-of-war between sellers and buyers.
Should sellers successfully breach the $3K support level, a strong bearish trend could emerge in the mid-term. However, considering recent price dynamics and prevailing market sentiment, there is an expectation for Ethereum to garner sufficient bullish momentum, potentially leading to a renewed uptrend toward the $3.6K threshold.
By Shayan
Amid Ethereum’s recent period of sideways consolidation and uncertain price action, investors are closely monitoring the behavior of traders in the futures market to gain insights into potential market sentiment shifts.
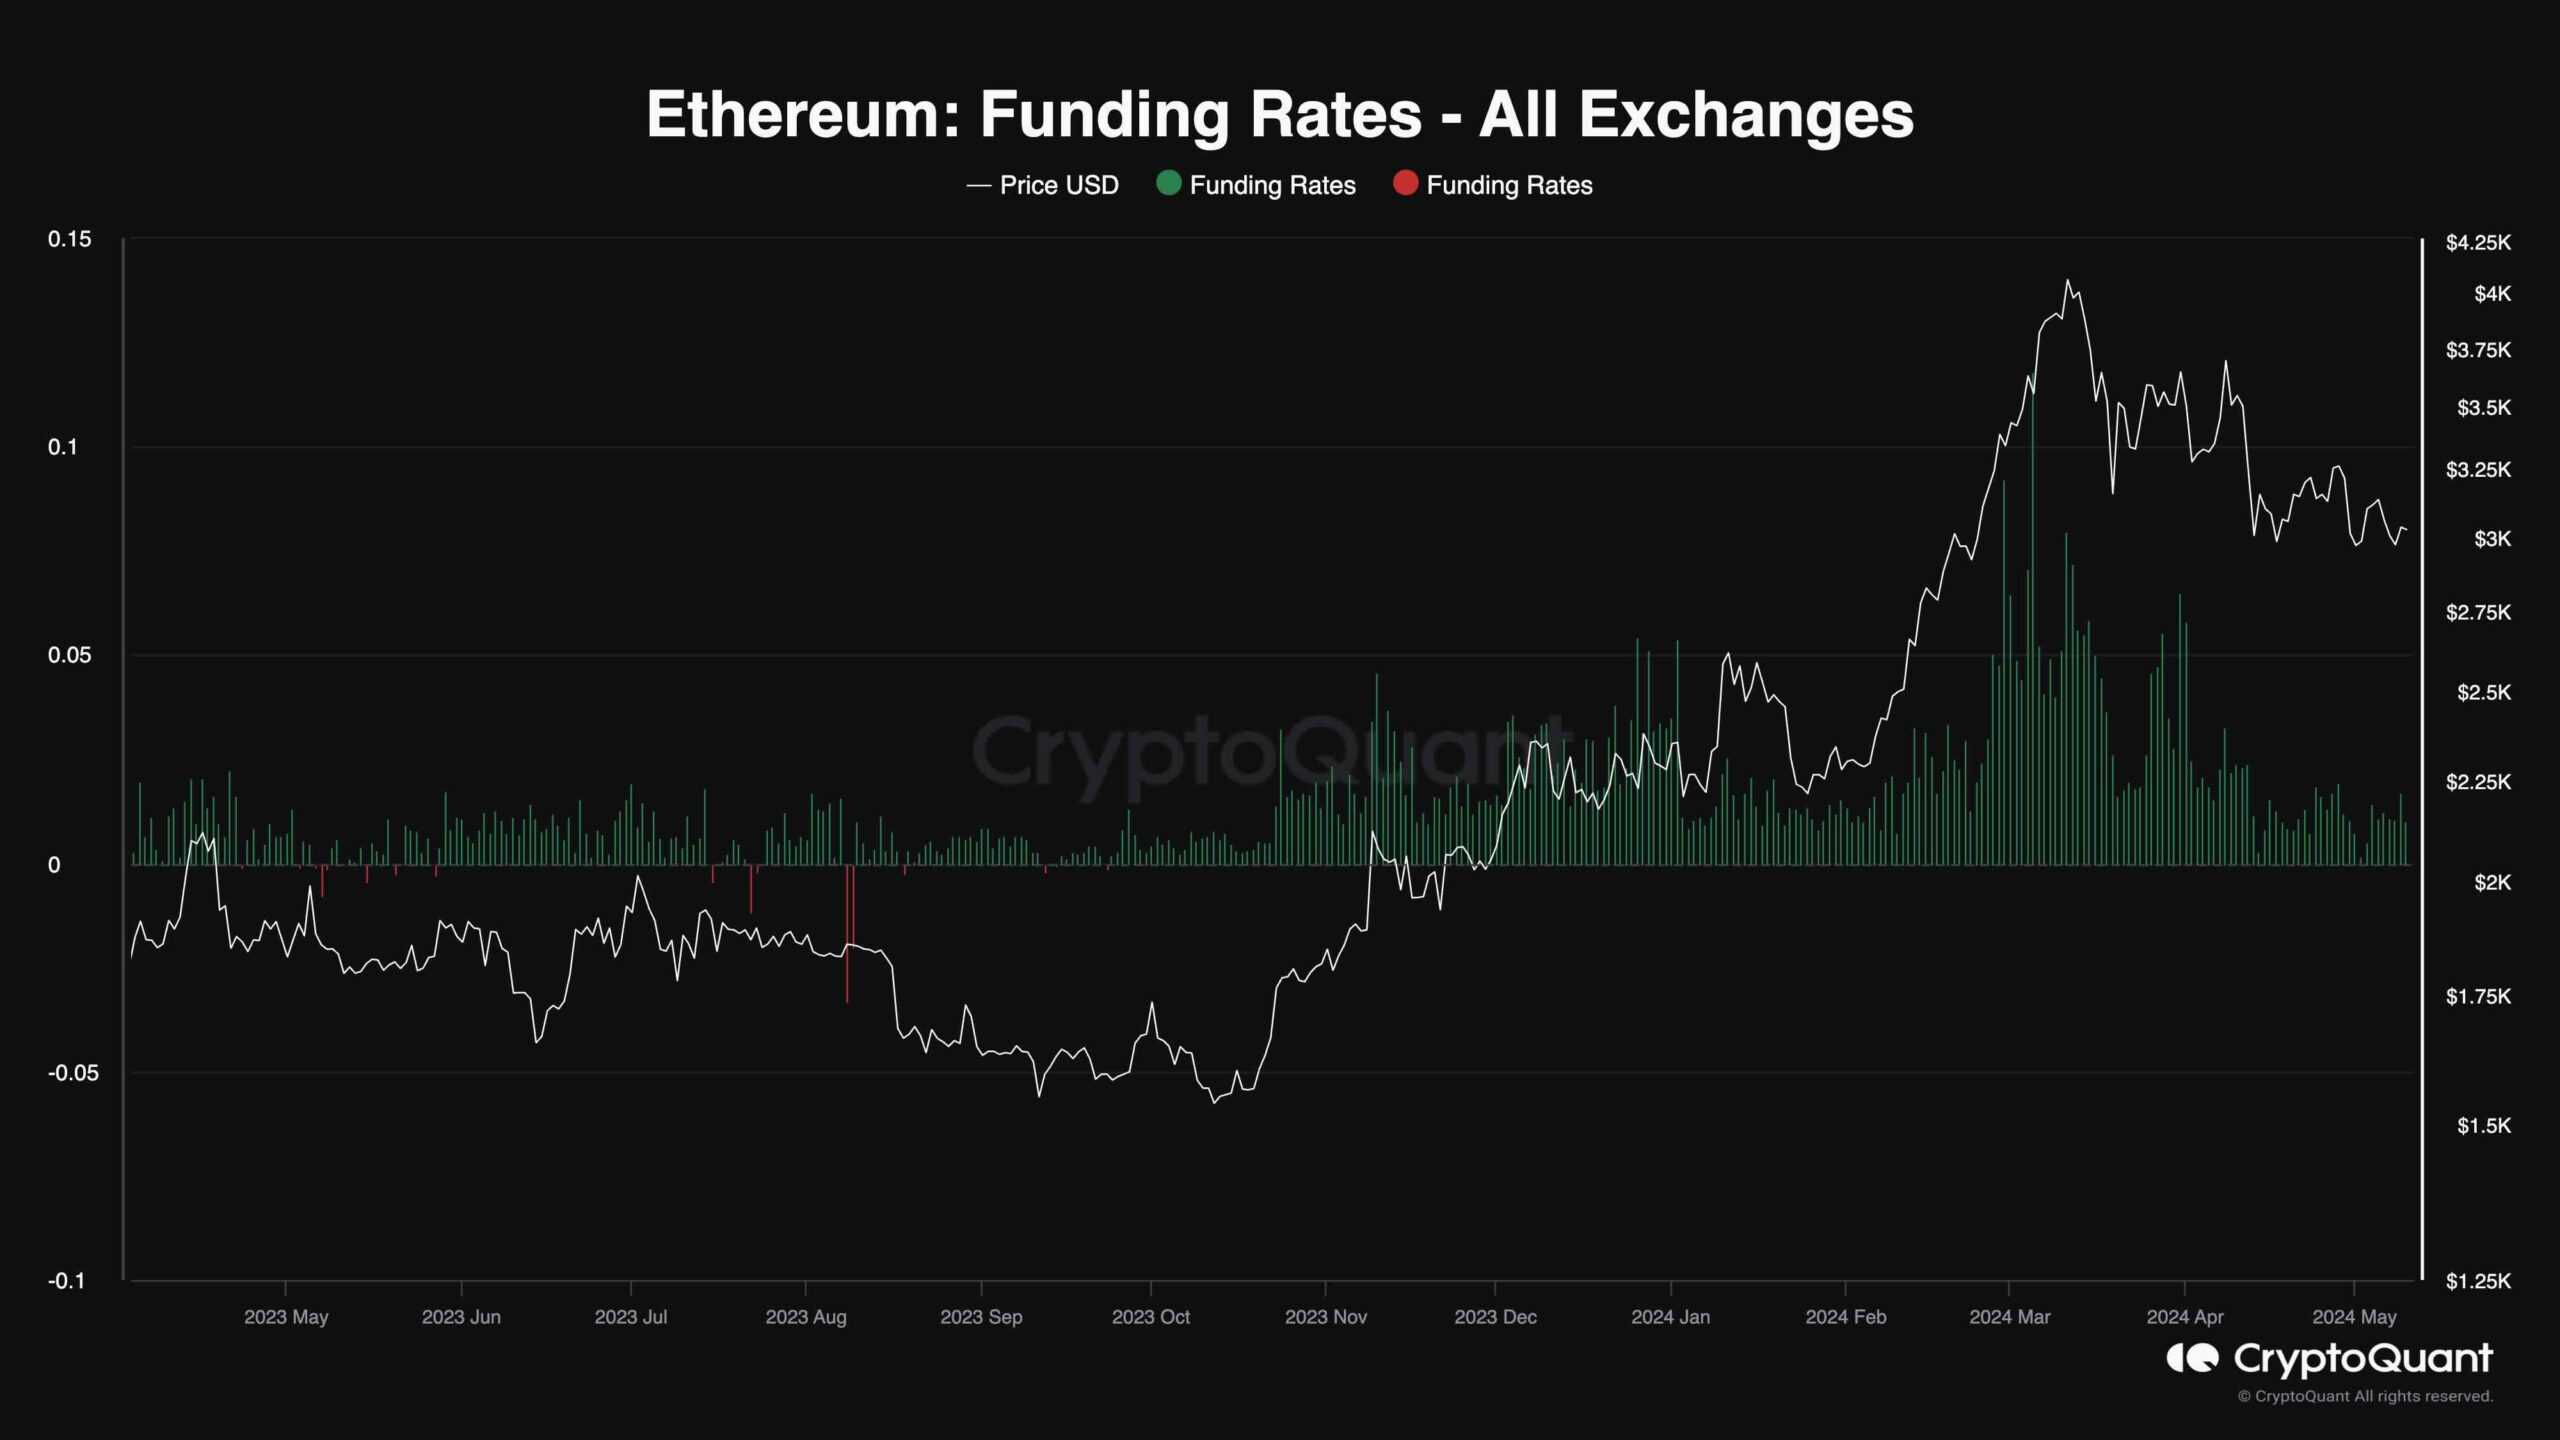
The chart provided illustrates the Ethereum funding rates metric, which assesses whether buyers or sellers are executing their future orders more aggressively, primarily using market orders. Positive values indicate bullish sentiment, while negative values reflect bearish expectations.
The chart reveals a significant drop in funding rates compared to levels observed a few months ago. Despite the decline, funding rates remain low but positive, suggesting a bullish signal. This indicates that demand is still present while the futures market is no longer overheated. Consequently, this situation suggests the potential for a price rally in the near future.