

On our yesterday’s price analysis we mentioned the fact that Bitcoin is trading around a weak and fragile zone: The bottom trend-line of the ascending channel, along with the critical $4000 – $4050 support area.
As of now, Bitcoin had broken the ascending channel support and found support at $3900. Since then, the movement is consolidating beneath the support-turned resistance 200 days moving average line (marked in blue on the following chart).
Looking at the 1-day & 1-hour charts
- The mid-term: Looking at the 1-day candle, there are still a couple of hours, but unless Bitcoin closes the day above $4100, the ascending trend-line of the daily chart will break.
- Still, on the daily chart, the RSI indicator is still testing the mid-term trend-line as resistance, while the Stochastic RSI oscillator is very close to cross at the overbought area.
- The trading volume decrease from day to day, but, still high volumes compared to the days before the breakdown of the $6000 area.
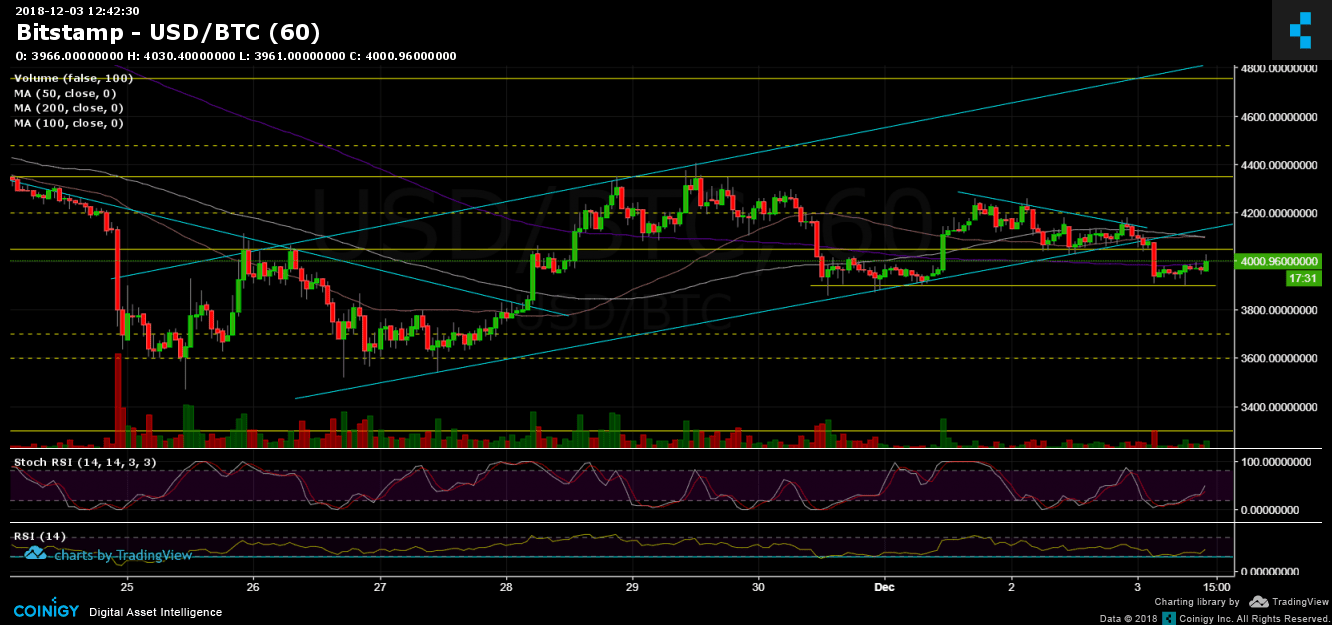
- The hourly chart’s Stochastic RSI had crossed at the oversold area. This might indicate on a possible correction up, maybe to test the resistance at $4050 for one last time.
- From the bear side, the next support levels lie at $3900, $3800 and $3700, before getting to the yearly low’s area at $3500.
- From the bull side, the next major resistance level lies around $4050, afterward is the $4250, and then the $4350 level. A bullish scenario might send Bitcoin to re-test the higher trend-line of the channel at the $4700 – $4800 area.
- BitFinex’s open short positions have sharply increased to 36.3K. We discussed the option of a short squeeze here.
BTC/USD BitStamp 1-Hour chart
BTC/USD BitStamp 1-Day chart

Cryptocurrency charts by TradingView. Technical analysis tools by Coinigy.
Disclaimer: Information found on CryptoPotato is those of writers quoted. It does not represent the opinions of CryptoPotato on whether to buy, sell, or hold any investments. You are advised to conduct your own research before making any investment decisions. Use provided information at your own risk. See Disclaimer for more information.


