For the past ten days, the Bitcoin price was trading mostly inside a $200 range between $9000 and $9200.
This behavior is very uncommon to a volatile asset such as Bitcoin. Some technical signs point on an end to this saga very soon, probably as the new week starts.
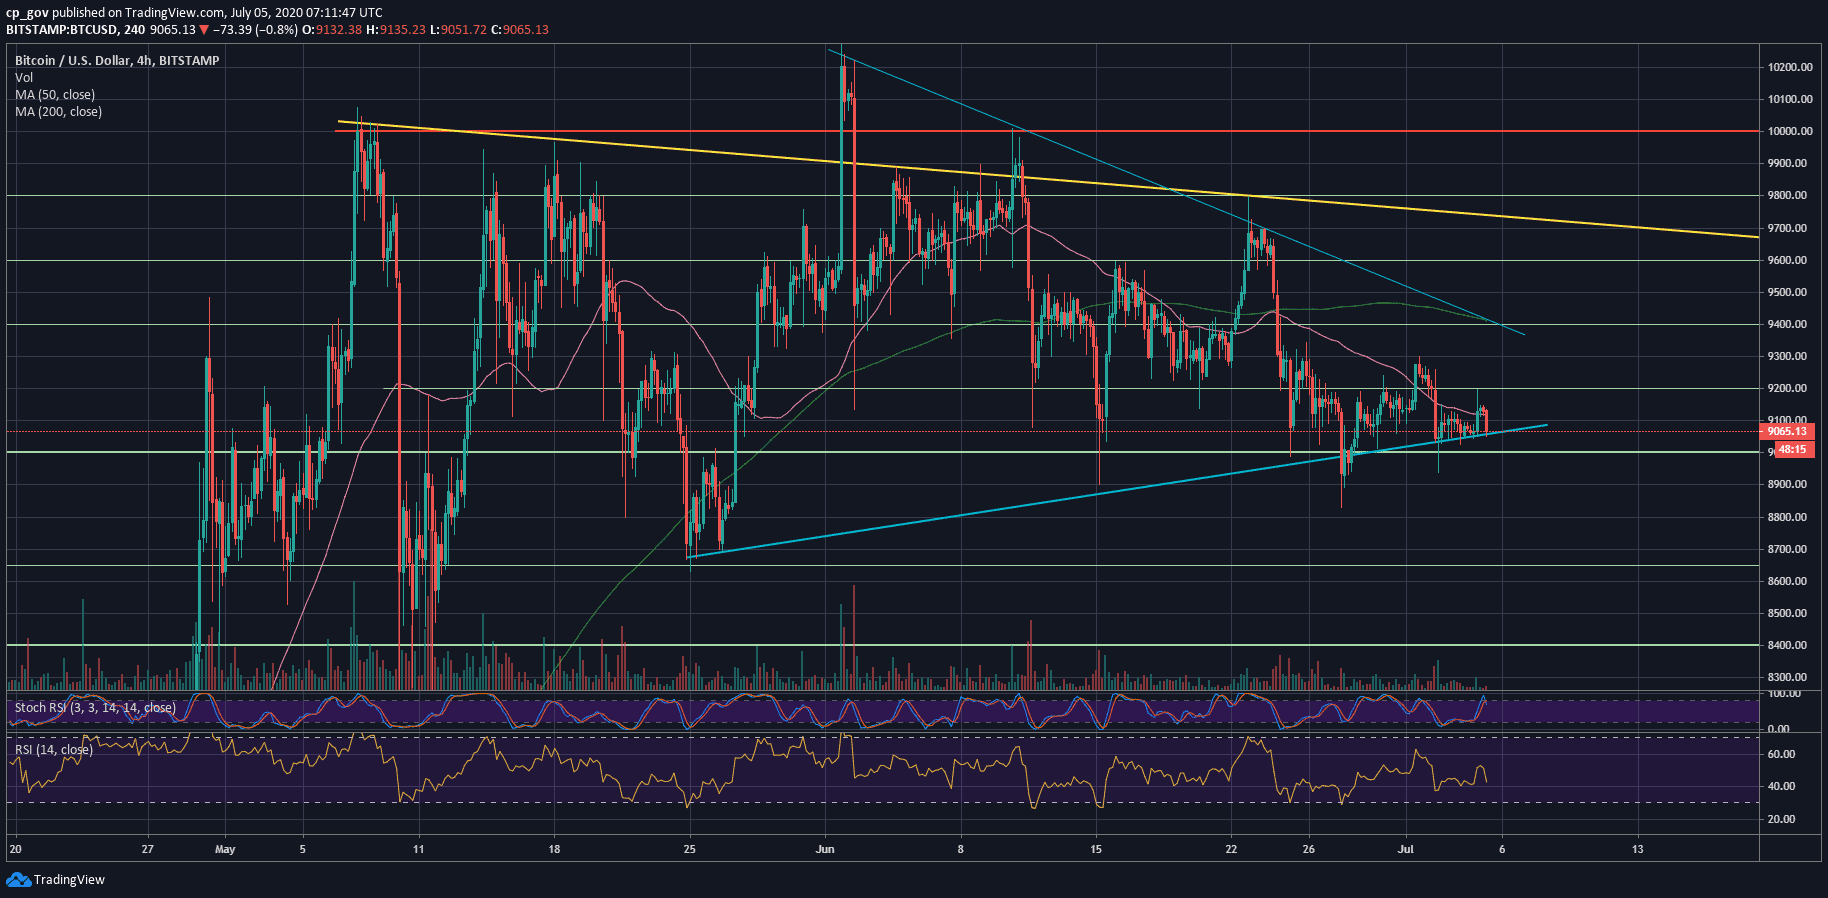
As can be seen on the following 4-hour chart, Bitcoin is trading inside a symmetrical triangle pattern.
While yesterday BTC was about to break it down from its lowest angle, Bitcoin found support and produced a quick $150 price movement. Guess where? Accurately the top of the mentioned range at $9200.
As can be seen below, this candle ended with a massive wick to the upside, no breakout, and as of writing theses lines, Bitcoin price is testing the same lower angle (blue) of the triangle once again.
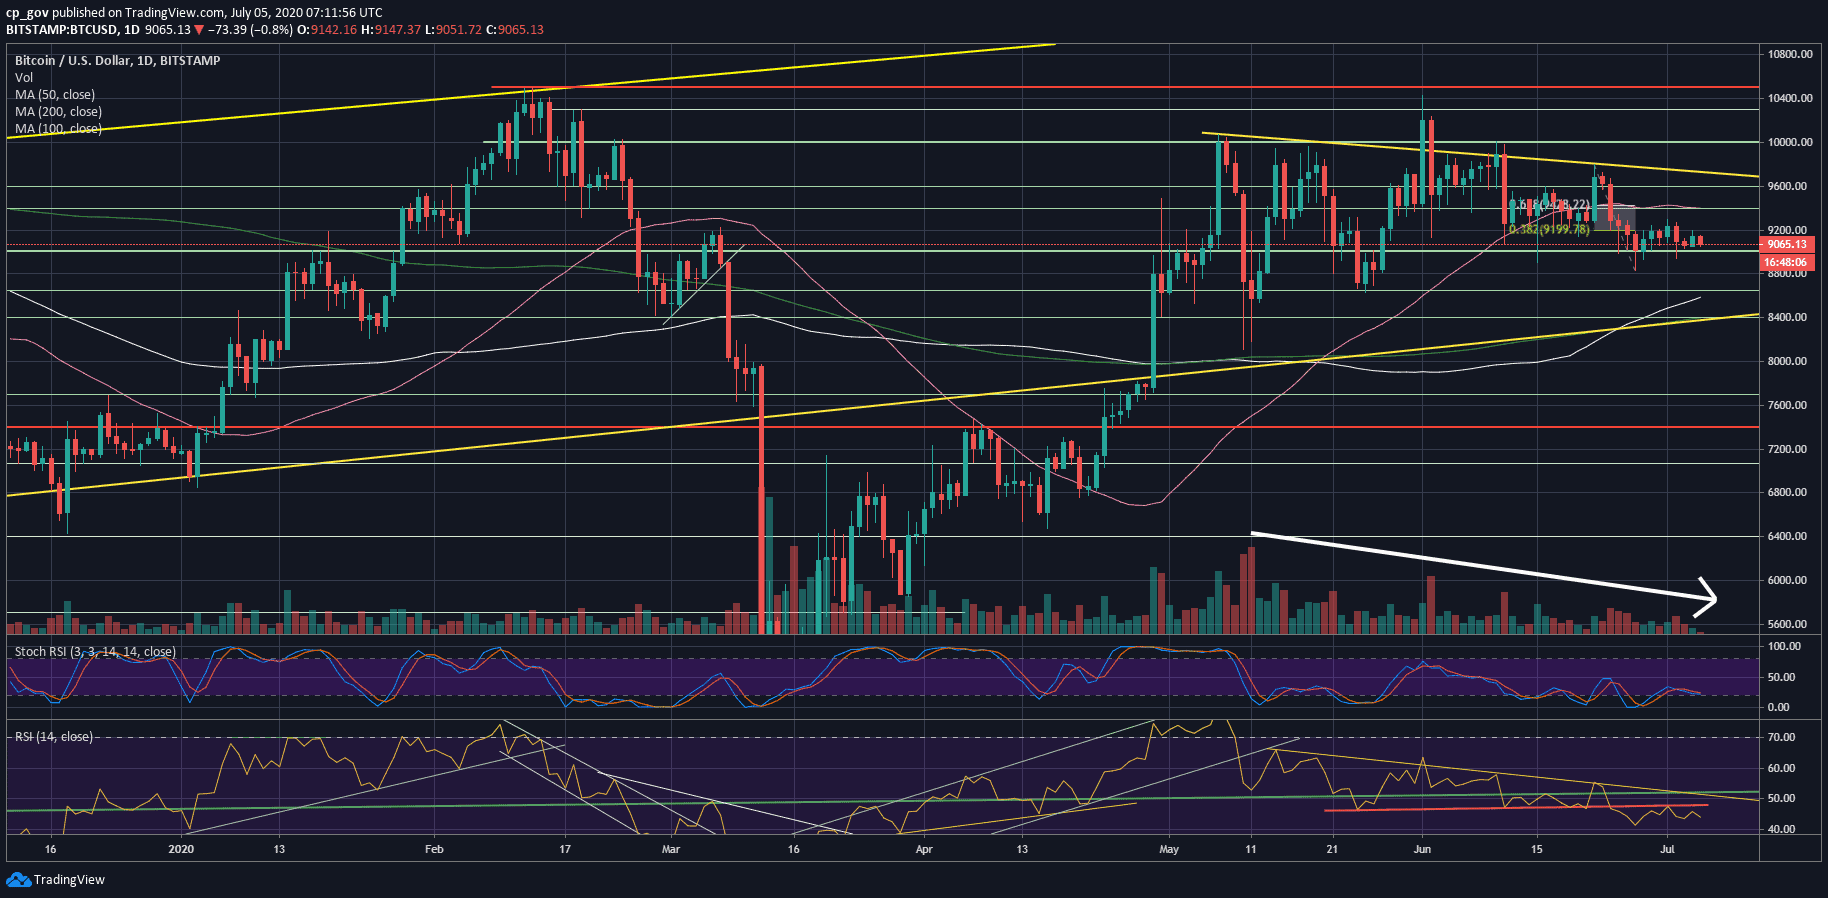
The trading volume: looking at the following daily chart, since May 11, 2020, which was the halving event of 2020, we are witnessing a declining pattern of volume candles. This is marked on the chart by a white arrow.
In fact, the last two weeks’ volume had seen the least amount of volume since March 2020. This is another sign of a coming up move that will raise some volume.
The daily RSI tends to the bearish side. As can be seen below, the red line (around 45-46) served as strong support. After breaking it down, Bitcoin confirmed it as resistance, and since then, the RSI is hovering at the bearish territory. A bullish trend can develop only in the case of an RSI above 50-52.
As mentioned above, Bitcoin is trading inside the tight range of $9000 – $9200. Any breakout will likely point out the next short-term direction for the price of Bitcoin.
From below, the first level of support lies around $9050, which is the lower angle of the blue triangle. This is followed by $9000.
Further below lies $8830 (last week’s low), $8600 (along with the 100-days moving average line – marked white) and $8400 (long-term ascending trend-line along with the significant 200-days MA).
From above, the first level of resistance is the $9200 level. This is followed by $9400, which includes the 50-days MA (pink) and the upper angle of the 4-hour blue triangle. Further above lies $9600.
Total Market Cap: $260 billion
Bitcoin Market Cap: $167.2 billion
BTC Dominance Index: 64.3%
*Data by CoinGecko