BTC Analysis
6 years ago

Bitcoin Chart Analysis March.6

Yuval Gov Mar 6, 2018 10:53

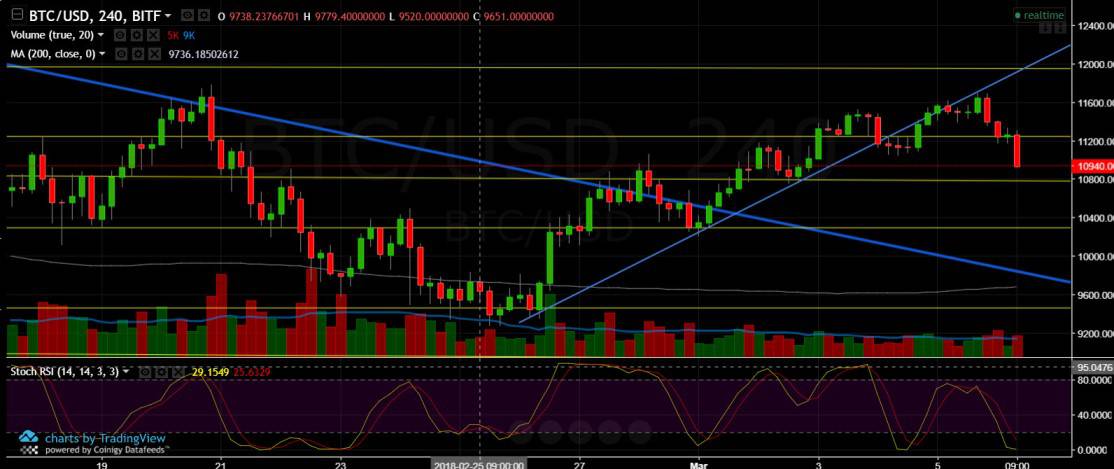
Since our previous analysis and overview, we have reached a resistance level at $11,700, which could end up to be a double-top (bearish sign) along with the high of February 20. To continue upward, we’ll need to see a break of the $11,700-12$K zone. This will set immediate targets at $13K and then $15K area.

As of now, Bitcoin broke the support level at $11,200, on its way to the next support area at $10,800. Volume is average, and Stochastic RSI oscillator might indicate on possible correction back up to $11,200 for the next hours, before deciding on direction. Breaking down the $10,800 support level will probably send us to test the $10-10,300 area again.

BTC/USD BitFinex 4 Hours chart

SPECIAL OFFER (Sponsored)
LIMITED OFFER 2024 for CryptoPotato readers at Bybit: Use this link to register and open a $500 BTC-USDT position on Bybit Exchange for free!


Disclaimer: Information found on CryptoPotato is those of writers quoted. It does not represent the opinions of CryptoPotato on whether to buy, sell, or hold any investments. You are advised to conduct your own research before making any investment decisions. Use provided information at your own risk. See Disclaimer for more information.

Share This Article
Yuval Gov

Yuval Gov has over 15 years of trading experience in the stock exchange, graduated from TAU - Economics and Management. Fell in love with the crypto space. Does Crossfit to get away from FOMO. Contact Yuval: LinkedIn