

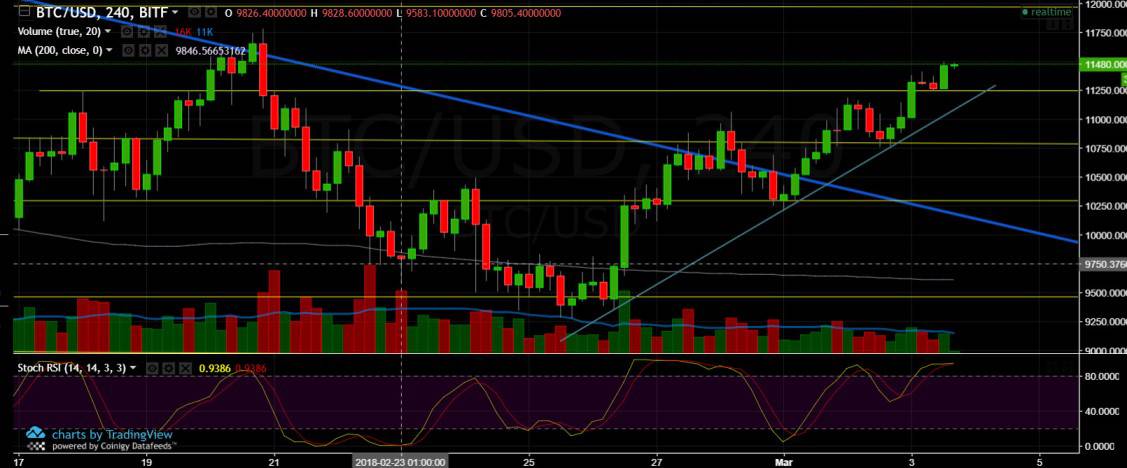
Bitcoin finally broke up the long-term descending trend line (marked with blue), this was followed by and impressive $1,000 gain in its price. This is a very positive sign for the short and middle term. We’ll not be surprised to see Bitcoin reaches highs of $13-15K.
As of now, strong resistance level lies around $11,900-$12K. Stochastic RSI oscillator indicates we’ll need some air before continue up – support level lies around $11,200 where resistance turned support meets the ascending line. If support doesn’t hold we’ll likely to test the $10,800 line again.
BTC/USD BitFinex 4 Hours chart
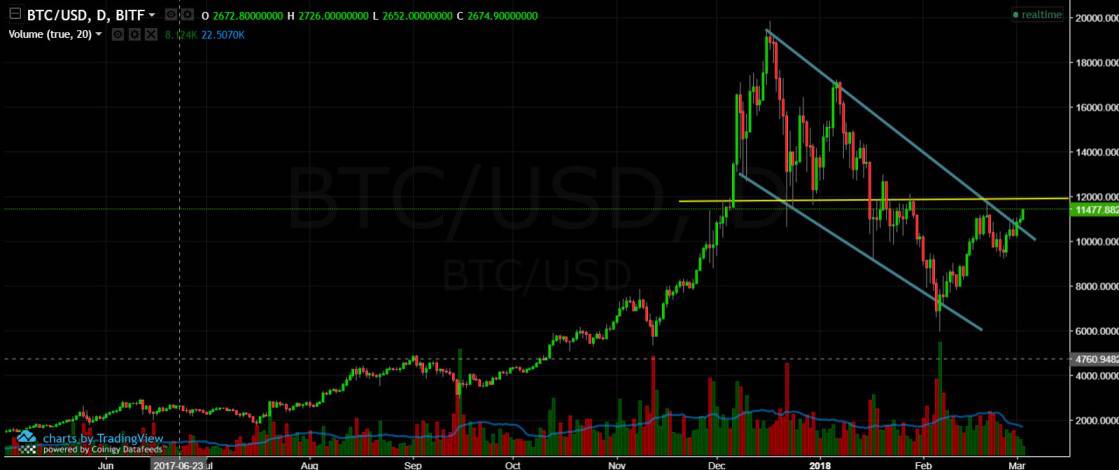
BTC/USD BitFinex 1 Day chart
On the overview graph, breaking it up is crucial to create a new high and break up the previous high at $11,600.
Disclaimer: Information found on CryptoPotato is those of writers quoted. It does not represent the opinions of CryptoPotato on whether to buy, sell, or hold any investments. You are advised to conduct your own research before making any investment decisions. Use provided information at your own risk. See Disclaimer for more information.


