BTC Analysis
6 years ago

Bitcoin Chart Analysis March.13

Yuval Gov Mar 13, 2018 11:25

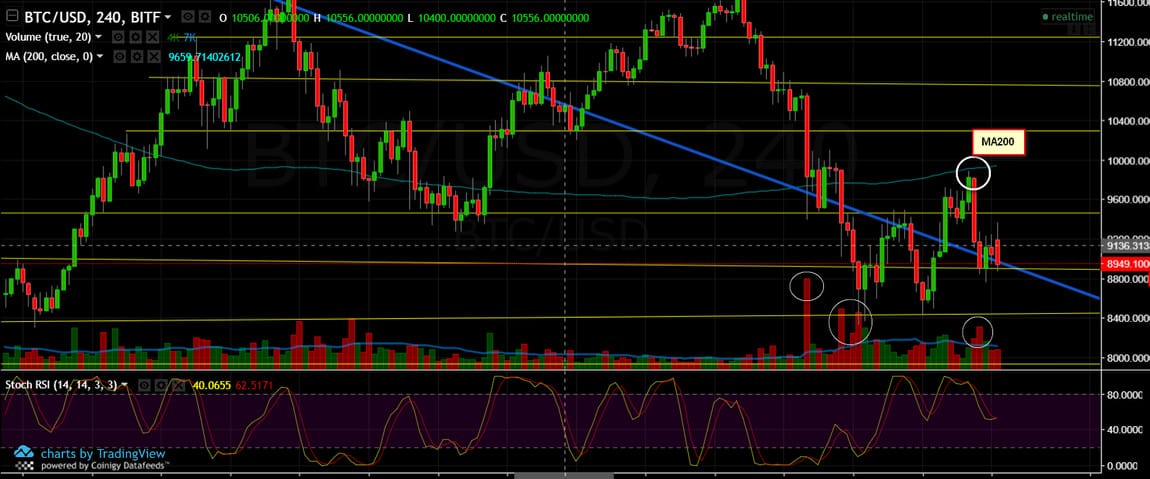
Sometimes there are days when it’s better not to trade at all. On our recent BTC analysis, we mentioned the importance of the $8,400 support for the short term. What we’ve seen over the past 48-hours is quick run up to $9,900, to the moving average MA-200, and even quicker retracement back to the long-term descending line  (marked in blue) at $9,000. The market is confusing and really hard to trade. So it’s better to focus on the bigger picture.

As of now, it looks as we are struggling to stay above the descending line and the $9,000 support area. Breaking it down will send us to test $8,400 support zone, the next major support area is the $7,800-8K level. The high volume of the sellers (relatively to the buyers) might be a sign that the overall direction is still down. On the bull side, gaining momentum from here, breaking up the $10K resistance area, and from there to the $10,800 resistance, and to the 30-day high at $11,700.

BTC/USD BitFinex 4 Hours chart

SPECIAL OFFER (Sponsored)
Binance Free $600 (CryptoPotato Exclusive): Use this link to register new account and receive $600 exclusive welcome offer on Binance (full details).

LIMITED OFFER 2024 for CryptoPotato readers at Bybit: Use this link to register and open a $500 BTC-USDT position on Bybit Exchange for free!


Disclaimer: Information found on CryptoPotato is those of writers quoted. It does not represent the opinions of CryptoPotato on whether to buy, sell, or hold any investments. You are advised to conduct your own research before making any investment decisions. Use provided information at your own risk. See Disclaimer for more information.

Share This Article
Yuval Gov

Yuval Gov has over 15 years of trading experience in the stock exchange, graduated from TAU - Economics and Management. Fell in love with the crypto space. Does Crossfit to get away from FOMO. Contact Yuval: LinkedIn