BTC Analysis
6 years ago

Bitcoin Chart Analysis March.11

Yuval Gov Mar 11, 2018 09:14

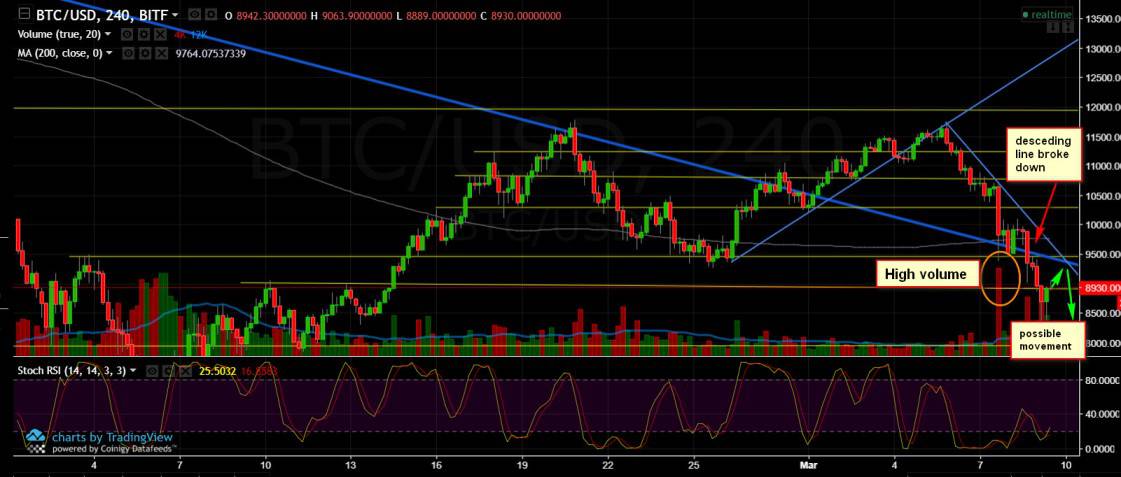
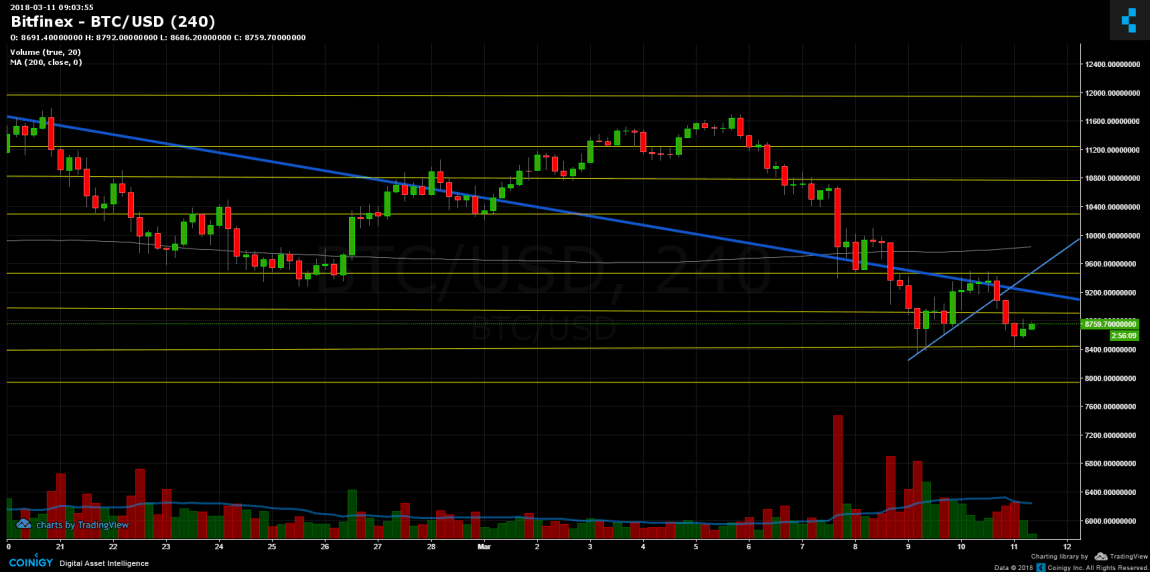
Just a quick BTC price update: The possible movement we expected on Friday had occurred accurately. Bitcoin tested the long-term descending line, was unsuccessful to break it up, and from there we have suffered a severe drop in 12 hours, losing $1,000 from its value, down to test again the support at $8,400.
From here, the bull scenario is that we had a double bottom, forming a “W” form, whereas on breaking the $9,500 will send us up to $10,300 and $10,800 resistance levels.
The more likely scenario now, is the bear one: Bitcoin breaks down the $8,400 support and from there the way to test the $7,800-$8,000 support area is pretty close. As we can see, the declines are followed by higher volume than the inclines, which indicates that the sellers are stronger than the buyers.

BTC/USD BitFinex 4 Hours chart


SPECIAL OFFER (Sponsored)
LIMITED OFFER 2024 for CryptoPotato readers at Bybit: Use this link to register and open a $500 BTC-USDT position on Bybit Exchange for free!


Disclaimer: Information found on CryptoPotato is those of writers quoted. It does not represent the opinions of CryptoPotato on whether to buy, sell, or hold any investments. You are advised to conduct your own research before making any investment decisions. Use provided information at your own risk. See Disclaimer for more information.

Share This Article
Yuval Gov

Yuval Gov has over 15 years of trading experience in the stock exchange, graduated from TAU - Economics and Management. Fell in love with the crypto space. Does Crossfit to get away from FOMO. Contact Yuval: LinkedIn