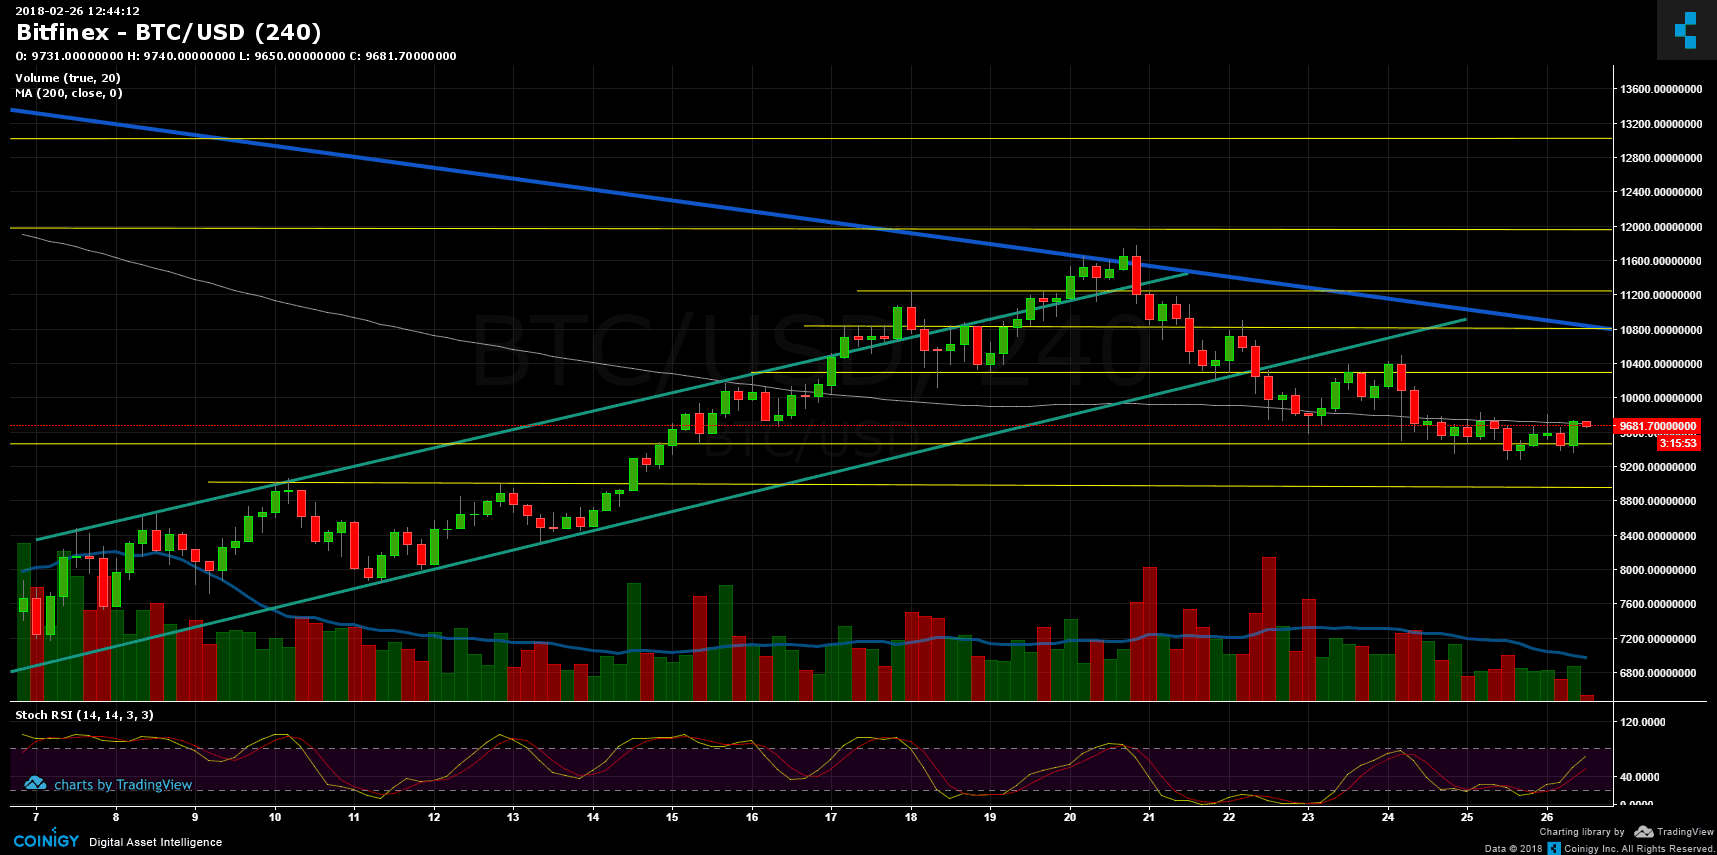
Breaking down the lower “channel” descending line was a very negative sign. This was followed by high volume, as mentioned in our Feb.24 analysis, Bitcoin continued down to the $9,400 support area and for the past 48 hours is consolidating there, around MA-200 (moving average of past 200 days, marked with pink line in the chart) followed by relatively low volume.
From here we might see a steady rise back up to test resistance around $10-$10,300 and from there to test the long-term descending line one more time at around $10,800 (marked in blue). Breaking down the $9,400 support will send us to $9,000 area.