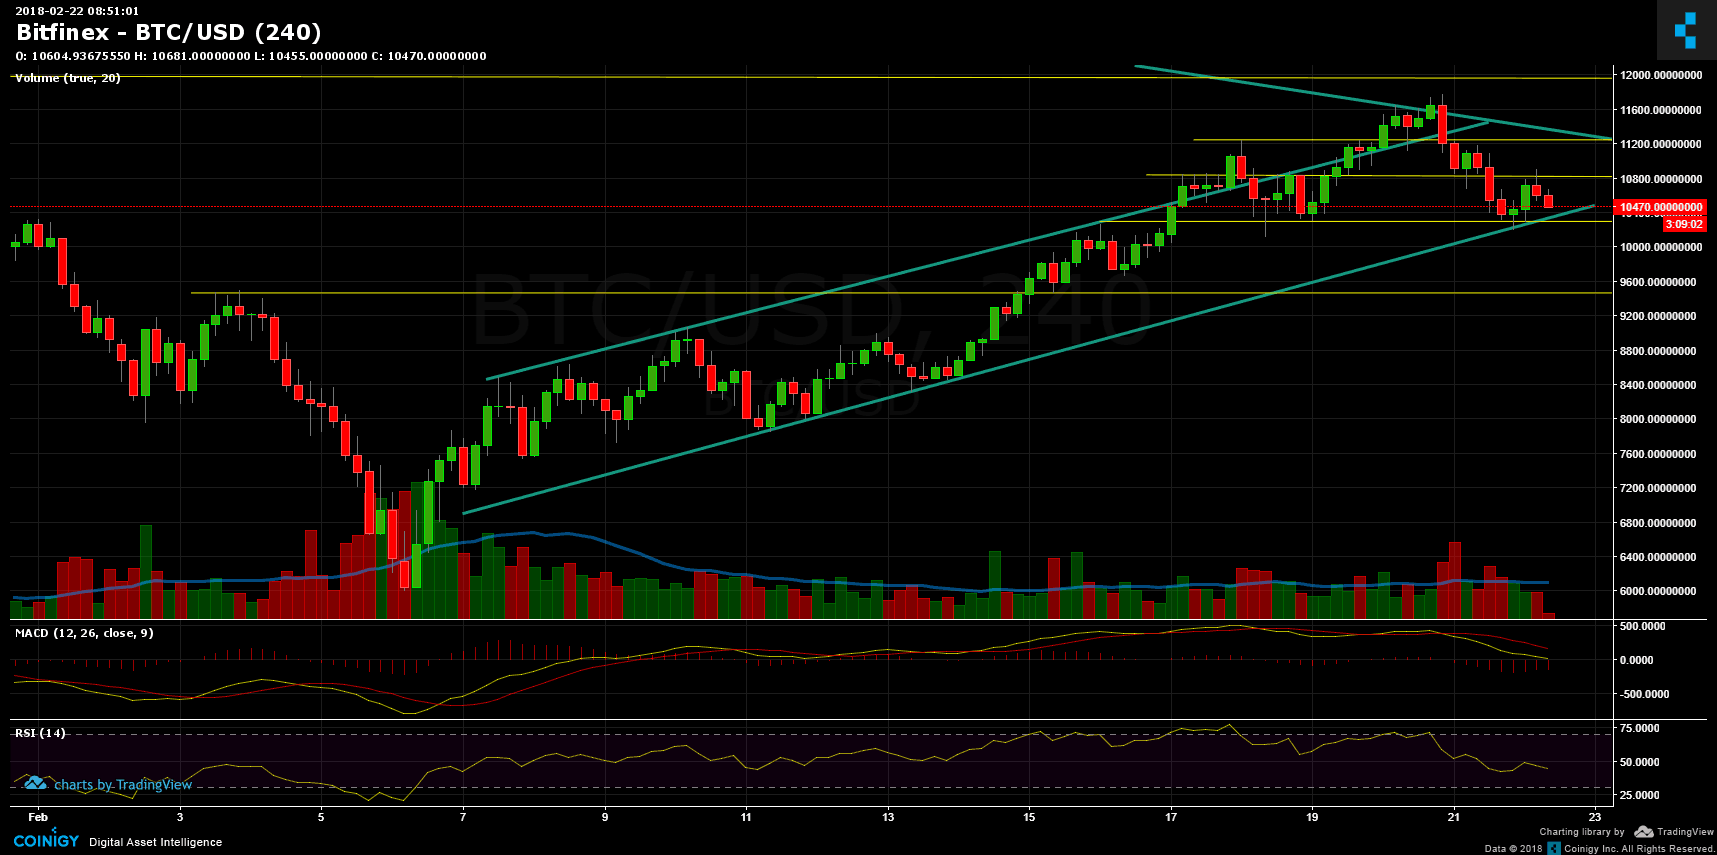
On yesterday’s analysis, we mentioned the option that Bitcoin is going to test the bottom of the ascending channel at $10,300 area. Right now Bitcoin is struggling to stay inside the ascending channel. Breaking it down, and the $10,000 support level, would send BTC to prior support level at $9,400, and then to $9,000. Resistance lies at $10,800 and $11,200 (where the major descending line is, from our overview analysis). Breaking up the descending line will send us to resistance at $12,000, $13,000 and longer target at $17,000. Right now it seems a little far away.
BTC/USD BitFinex 4 hours chart
SPECIAL OFFER (Sponsored)
Binance Free $600 (CryptoPotato Exclusive): Use this link to register new account and receive $600 exclusive welcome offer on Binance (
full details).
LIMITED OFFER 2024 for CryptoPotato readers at Bybit: Use this link to register and open a $500 BTC-USDT position on Bybit Exchange for free!
Disclaimer: Information found on CryptoPotato is those of writers quoted. It does not represent the opinions of CryptoPotato on whether to buy, sell, or hold any investments. You are advised to conduct your own research before making any investment decisions. Use provided information at your own risk. See Disclaimer for more information.