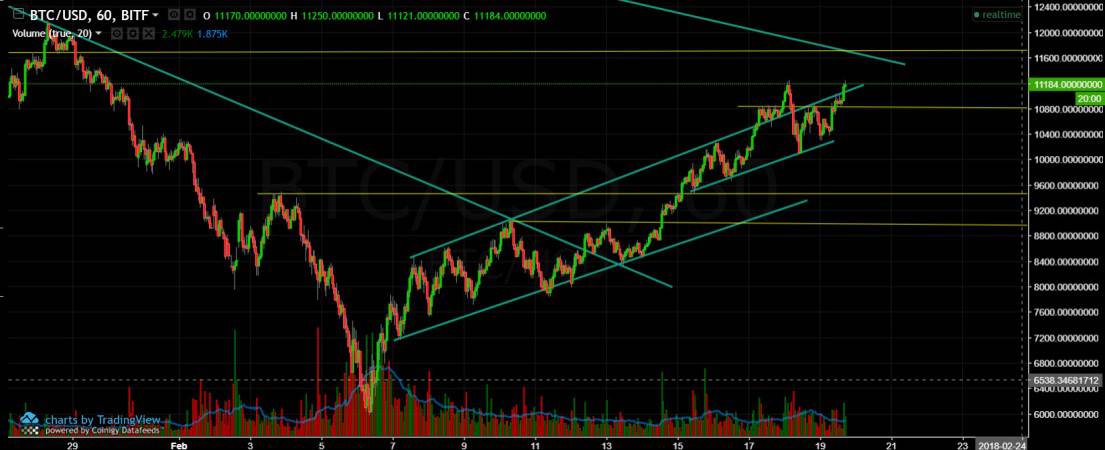
Over the past few hours Bitcoin had a nice bounce breaking up out the “tunnel” at resistance level of $11,000. As of now, the short-term looks positive towards the $11,800-12,000 resistance level. Breaking this level can also send us to higher levels and indicate on an end to the bear market we are currently at. Support lies at $10,800 and around $10,000-10,200 levels.
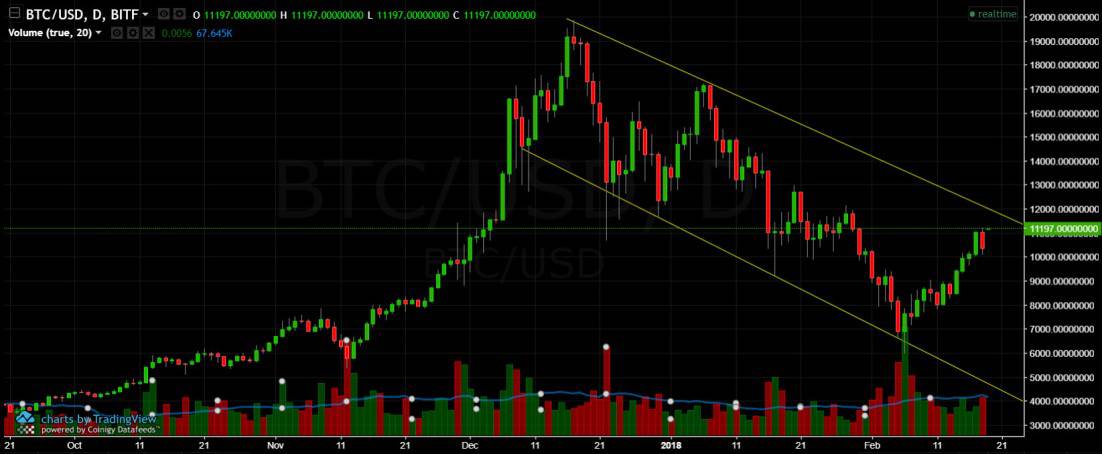
BTC 1 DAY Chart overview
Explanation to the below graph can be found in our recent overview.
SPECIAL OFFER (Sponsored)
LIMITED OFFER 2024 for CryptoPotato readers at Bybit: Use this link to register and open a $500 BTC-USDT position on Bybit Exchange for free!
Disclaimer: Information found on CryptoPotato is those of writers quoted. It does not represent the opinions of CryptoPotato on whether to buy, sell, or hold any investments. You are advised to conduct your own research before making any investment decisions. Use provided information at your own risk. See Disclaimer for more information.