

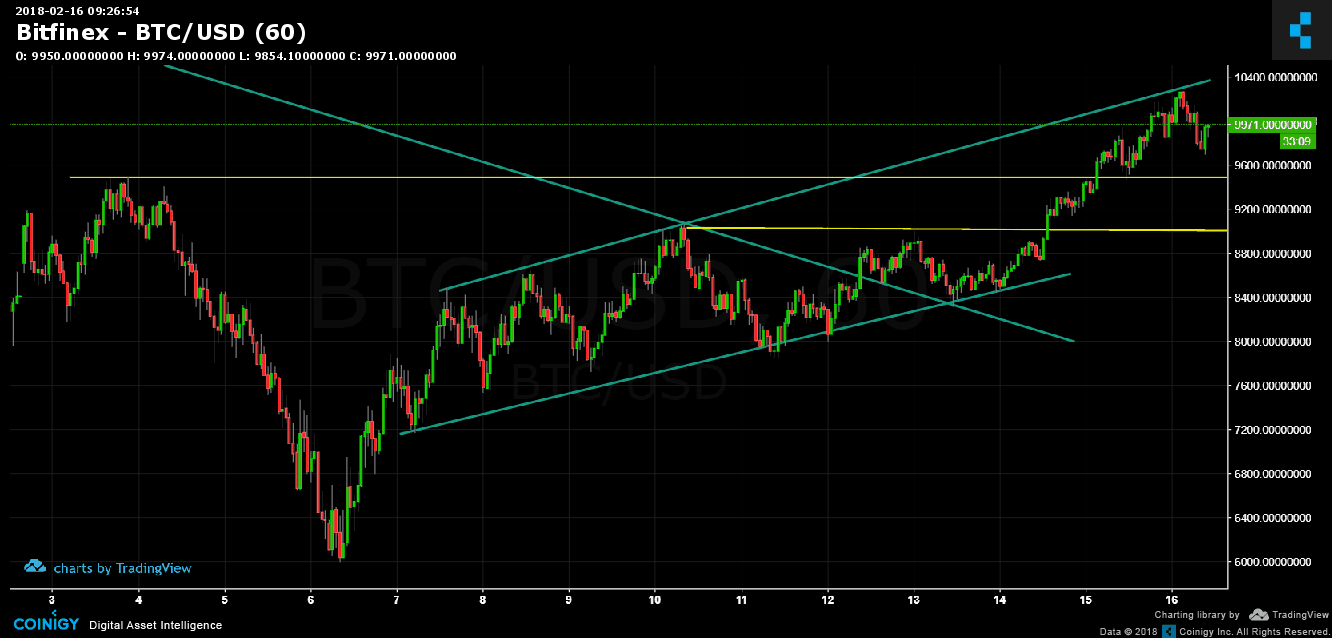
Bitcoin is following the plan from yesterday: Heading rapidly to the target level around $10,000 – at the top of the “tunnel” as shown in our chart analysis. After touching $10,200 at the top of the tunnel, Bitcoin is currently consolidating around the 10K mark for a possibility of breaking up the resistance. Support level lies at $9,400, and further down at $9,000.
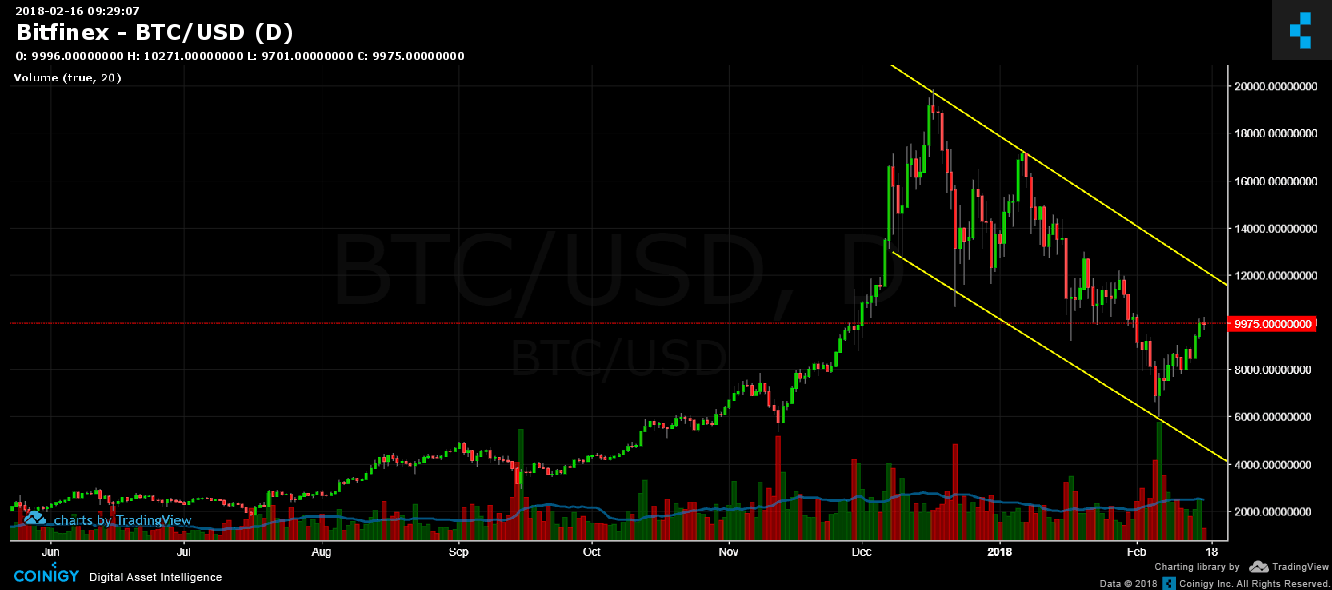
BTC 1 DAY Chart overview
In order to give a depth picture in terms of the Bitcoin, we need to have a look at the 1 day chart (where each candle represents one day). It should be noted form the chart that the end of the official decline will probably happen as we see a break of the previous high around $12,000-13,000 mark. This point also integrates with the descending line. At any point under the descending line we may still return down. The $10,000 mark is a fundamental psychological level whose breakout may attract the press and create announcements that will fuel up the rise required to overcome the $12,000-13,000 levels.
Up until now, we had a healthy incline – a consolidation before the $9,000 break, a consolidation before the $9,400 break, and now facing the $10,000 – It is unlikely that it will come without a longer consolidation.
We are not seeing a sharp parabolic rise or anything that signals of massive money entering, as expected after a 70% drop, followed by a 50% correction.
Seems like buyers haven’t decided yet, according to the decreasing trading volume during recent inclines.
Disclaimer: Information found on CryptoPotato is those of writers quoted. It does not represent the opinions of CryptoPotato on whether to buy, sell, or hold any investments. You are advised to conduct your own research before making any investment decisions. Use provided information at your own risk. See Disclaimer for more information.


