New data comparing Bitcoin’s fundamentals now and around the second halving in 2016 demonstrates the immense growth of the network.
Double, triple, and even quadruple-digit increases are evident in almost all areas, including the number of BTC addresses, the hashrate, and the daily transaction volume.
While most members of the community are focused on the volatile price movements around the halvings, new information compiled by GlassNode takes thorough look at how Bitcoin’s fundamentals have developed since July 2016.
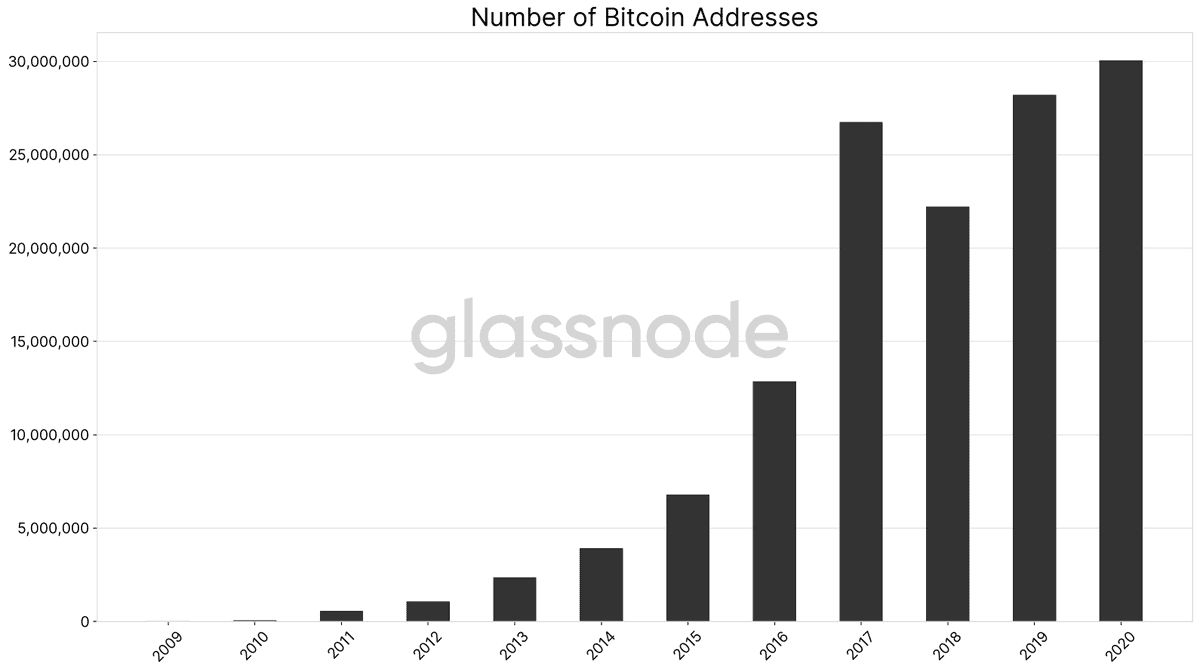
For starters, the number of BTC addresses has jumped by 234%. Those addresses are at an all-time high at the moment (over 30m). Interestingly, the number is even higher than during the parabolic price increase in 2017.
As CryptoPotato recently reported, the interest in opening new addresses containing at least 0.01 BTC has been surging lately, with over 430,000 created in the past 90 days.
Additionally, addresses with at least 1 BTC and 0.1 BTC are also higher than in 2016 by 64% and 142%, respectively. GlassNode concluded that those addresses are “hitting new ATHs in 2020 almost on a daily basis.”
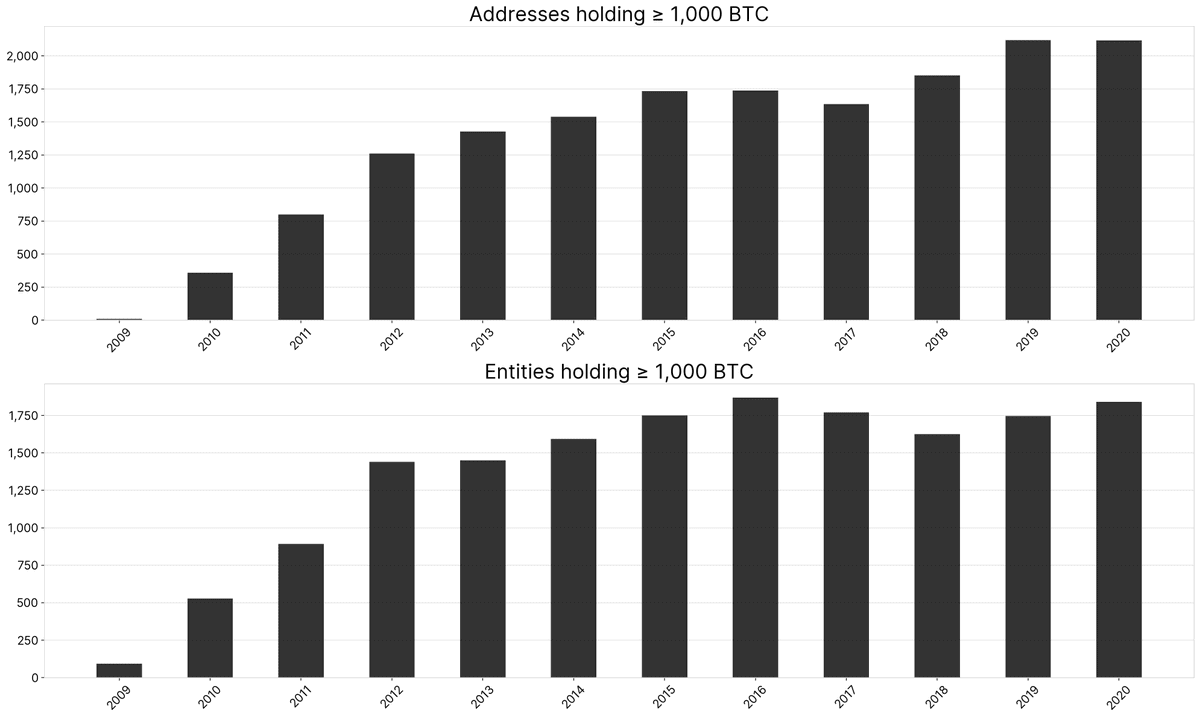
Entities holding 1,000 BTC or more is the only measure which has decreased slightly (7%) compared to the 2016 data. On the other hand, addresses with such quantity have increased by 13%. It’s worth noting, though, that with Bitcoin’s price being significantly higher, it’s more expensive to buy 1,000 bitcoins.
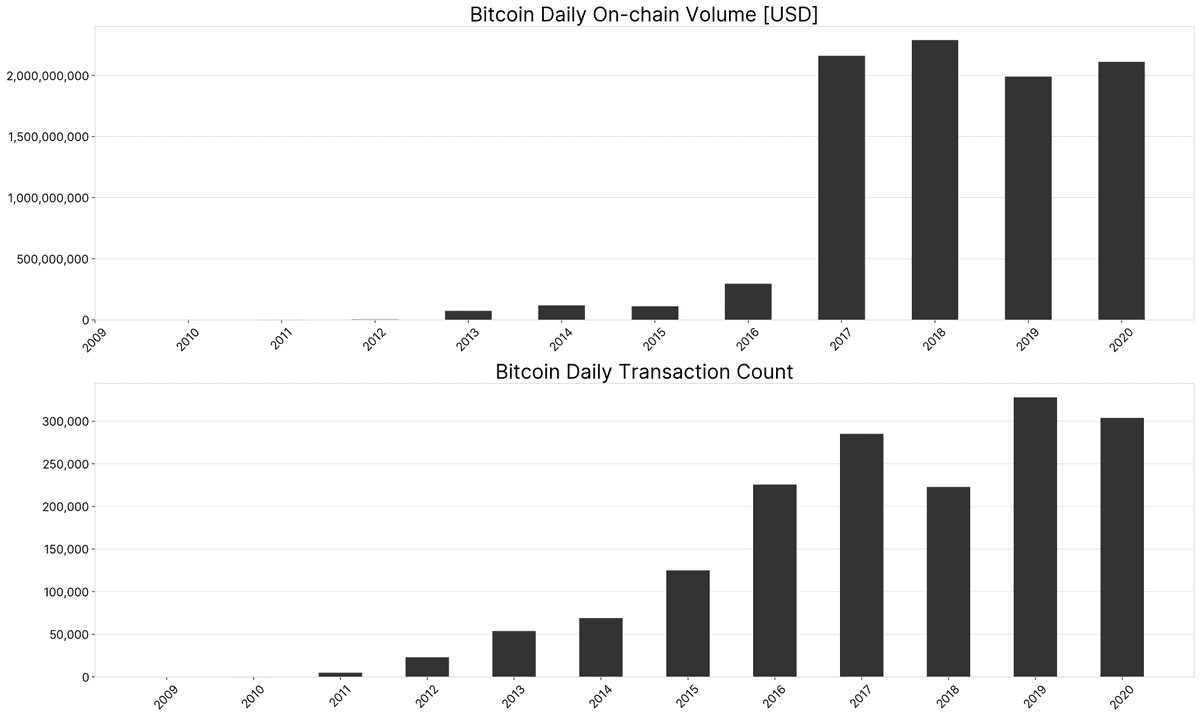
The daily transaction count and volume have seen substantial growth as well. More specifically, the transaction count is now 44% higher than in 2016, while the volume has skyrocketed by 682% to over $2.1B per day. In fact, GlassNode informs that the on-chain volume (USD) has been constantly high since 2017.
Although the above data illustrates significant increases in almost all areas, none has been more impressive than the growth of the hashrate. Back in 2016, the BTC hashrate was about 1,571,587 TH/sec and now it is 109,034,592 TH/sec. To put this in another perspective – it’s a surge of 6837% in four years.
Moreover, hashrate ATHs are registered quite regularly, indicating that miners are putting more and more computational power into maintaining the network.
Nevertheless, it will be compelling to follow how the third-ever halving, estimated to take place in merely hours, will affect the hashrate and the other areas of the network. After all, the rewards miners receive for their efforts will be slashed in half to 6.25 BTC per block.