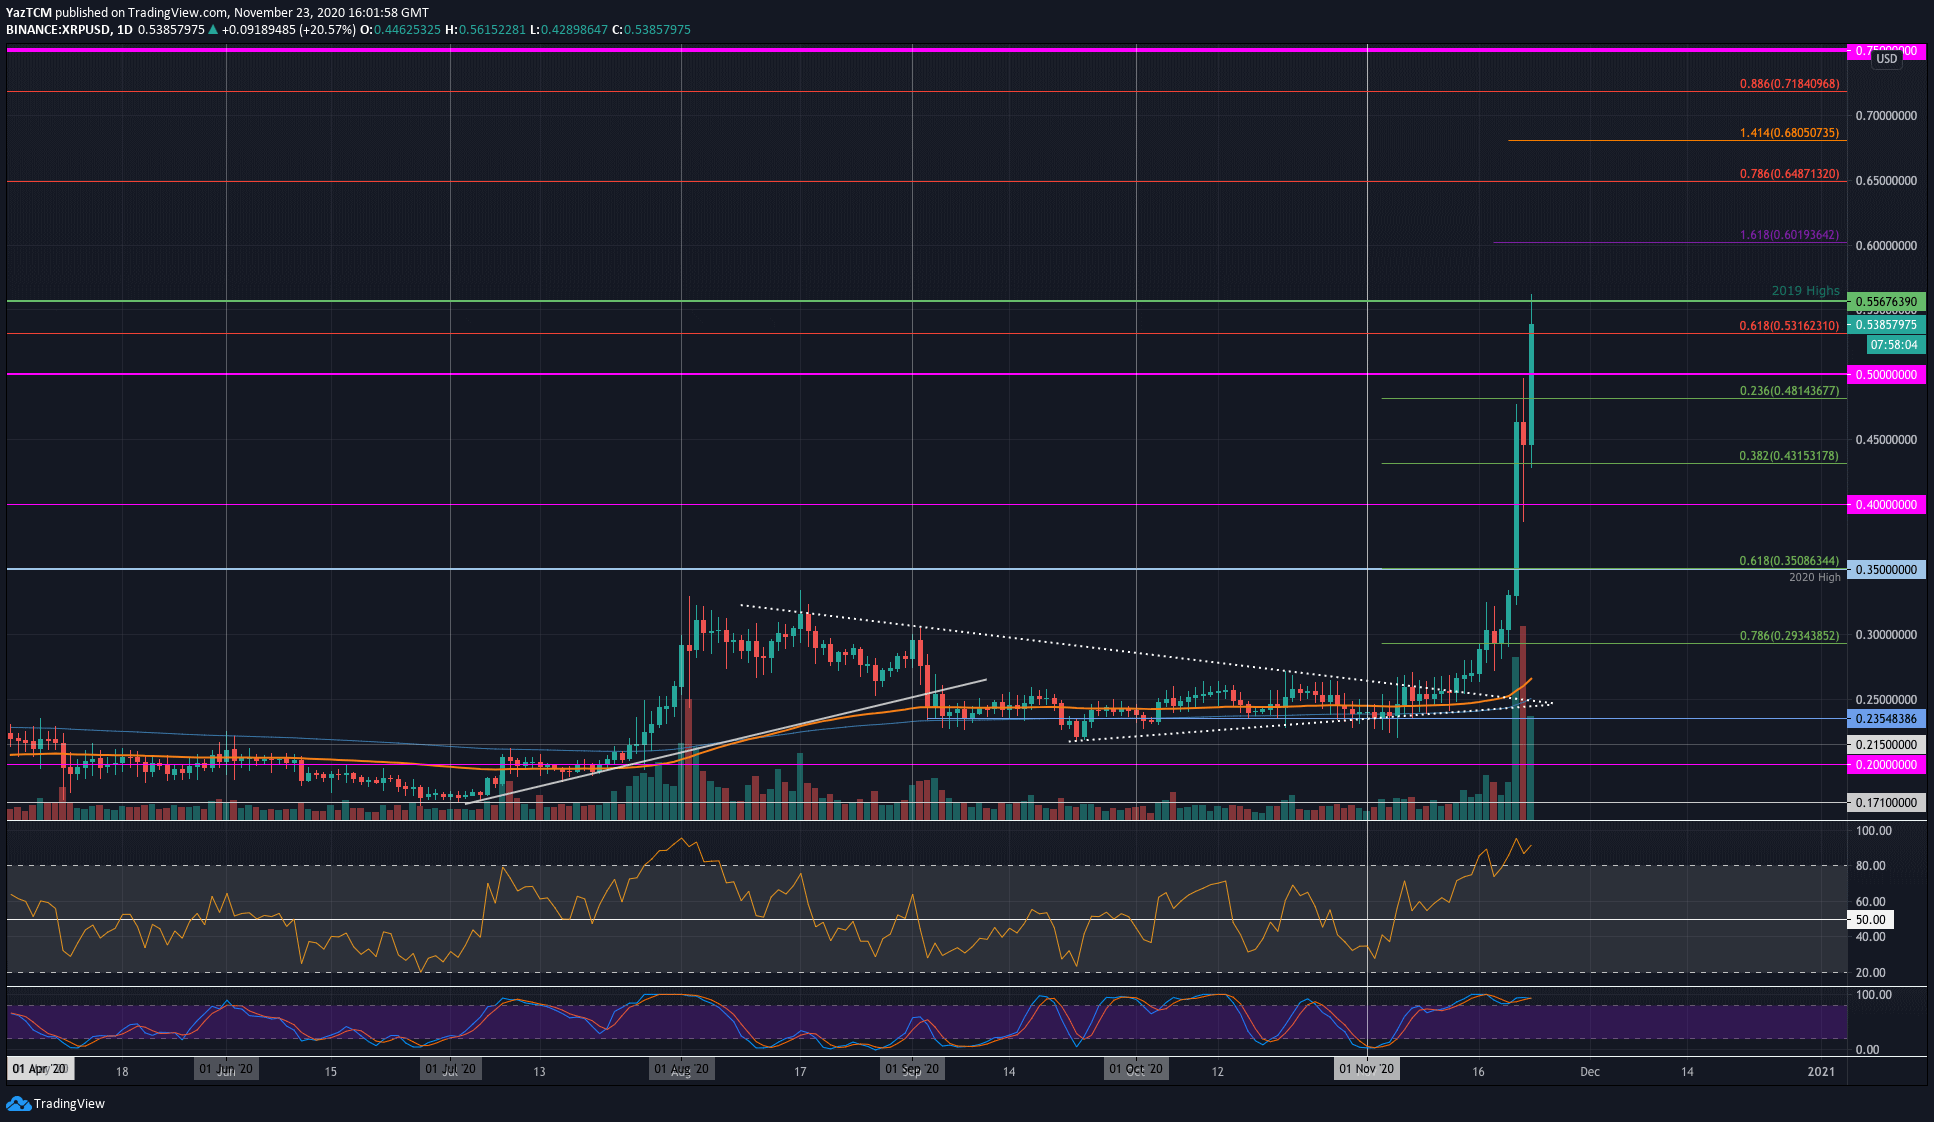
XRP/USD Daily Chart. Source: TradingView
Key Support Levels: $0.5, $0.481, $0.45.
Key Resistance Levels: $0.556, $0.58, $60.
The growth of XRP over this past week is truly remarkable. The cryptocurrency managed to surge by over 95% when it started to climb from $0.28 to explode higher and test the 2019 highs at $0.556 today.
The bulk of the price surge started on Saturday after XRP managed to break the 2019 high and push above $0.4 to reach the $0.48 level. The coin stalled on Sunday but managed to close the daily candle at $0.45.
Today, XRP pushed higher from $0.45 as it climbed by 22.6% to reach $0.556, where it tested the 2019 highs. It has since dropped slightly to trade at $0.538 – at the time of writing.
Looking ahead, the first level of resistance is expected at the 2019 Highs around $0.556. Above this, resistance is found at $0.58, $0.60 (1.618 Fib extension), and $0.65 (bearish .786 Fib Retracement). Added resistance lies at $0.68 (1.414 Fib Extension).
On the other side, the first level of support is located at $0.5. Beneath this, support lies at $0.481 (.236 Fib), $0.45, and $0.431 (.382 Fib).
As expected, the RSI and Stochastic RSI are in extremely overbought conditions as the market goes parabolic.
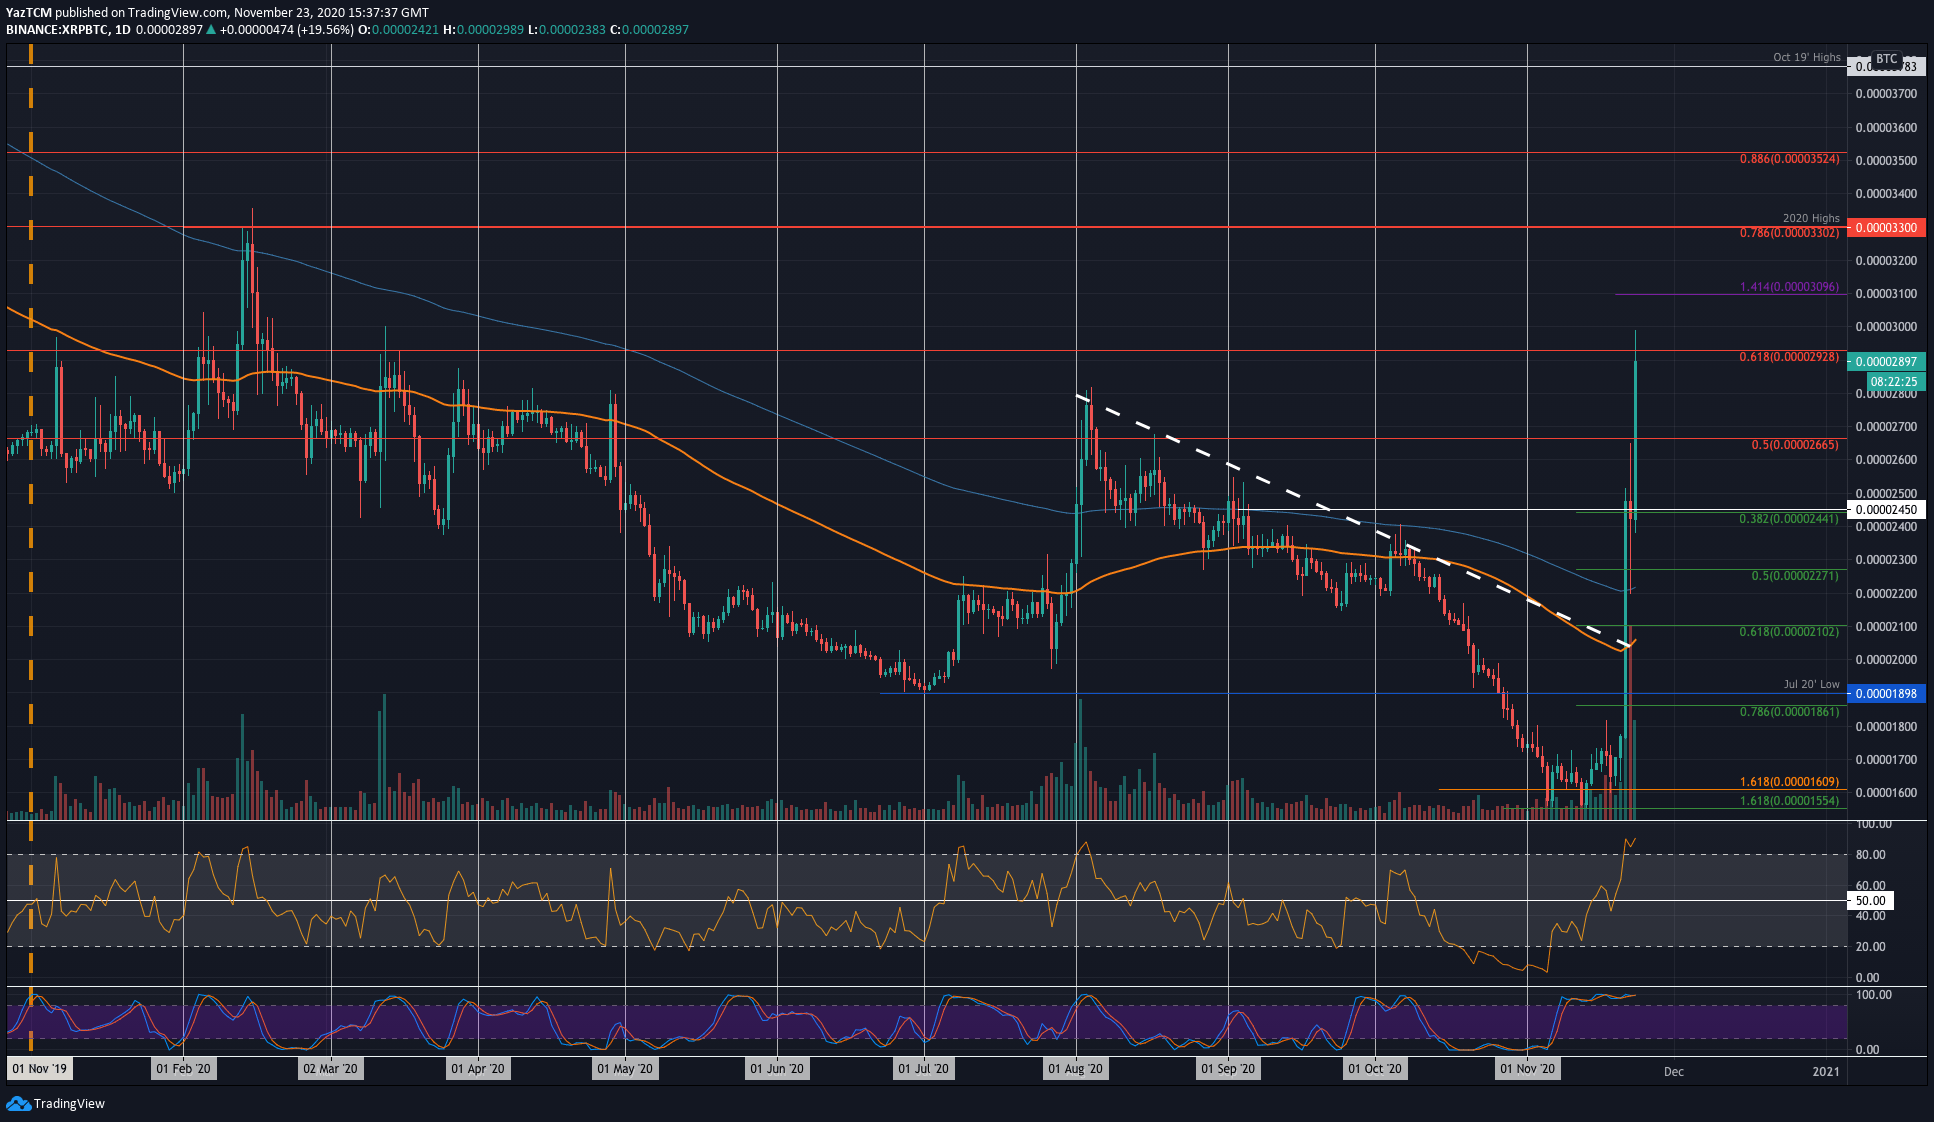
Key Support Levels: 2800 SAT, 2665 SAT, 2500 SAT.
Key Resistance Levels: 3000 SAT, 3100 SAT, 3200 SAT.
XRP is also performing extremely well against Bitcoin as it hit a fresh 8-month high today, touching the 3000 SAT level.
Likewise, it surged against BTC on Saturday when it pushed above 1800 SAT and the 200-days EMA to reach as high as 2500 SAT. The coin continued further today as it climbed from 2400 SAT to break resistance at 2665 SAT (bearish .5 Fib) and 2930 SAT (bearish .618 Fib) to hit the 3000 SAT level.
Looking ahead, if the buyers break 3000 SAT, the first level of resistance lies at 3100 SAT (1.4414 Fib Extension). This is followed by added resistance at 3200 SAT, 3300 SAT (bearish .786 Fib & 2020 Highs), and 3524 SAT (bearish .886 Fib).
On the other side, if the sellers push lower, the first level of support lies at 2800 SAT. Beneath this, support lies at 2665 SAT, 2500 SAT, and 2440 SAT (.382 Fib).