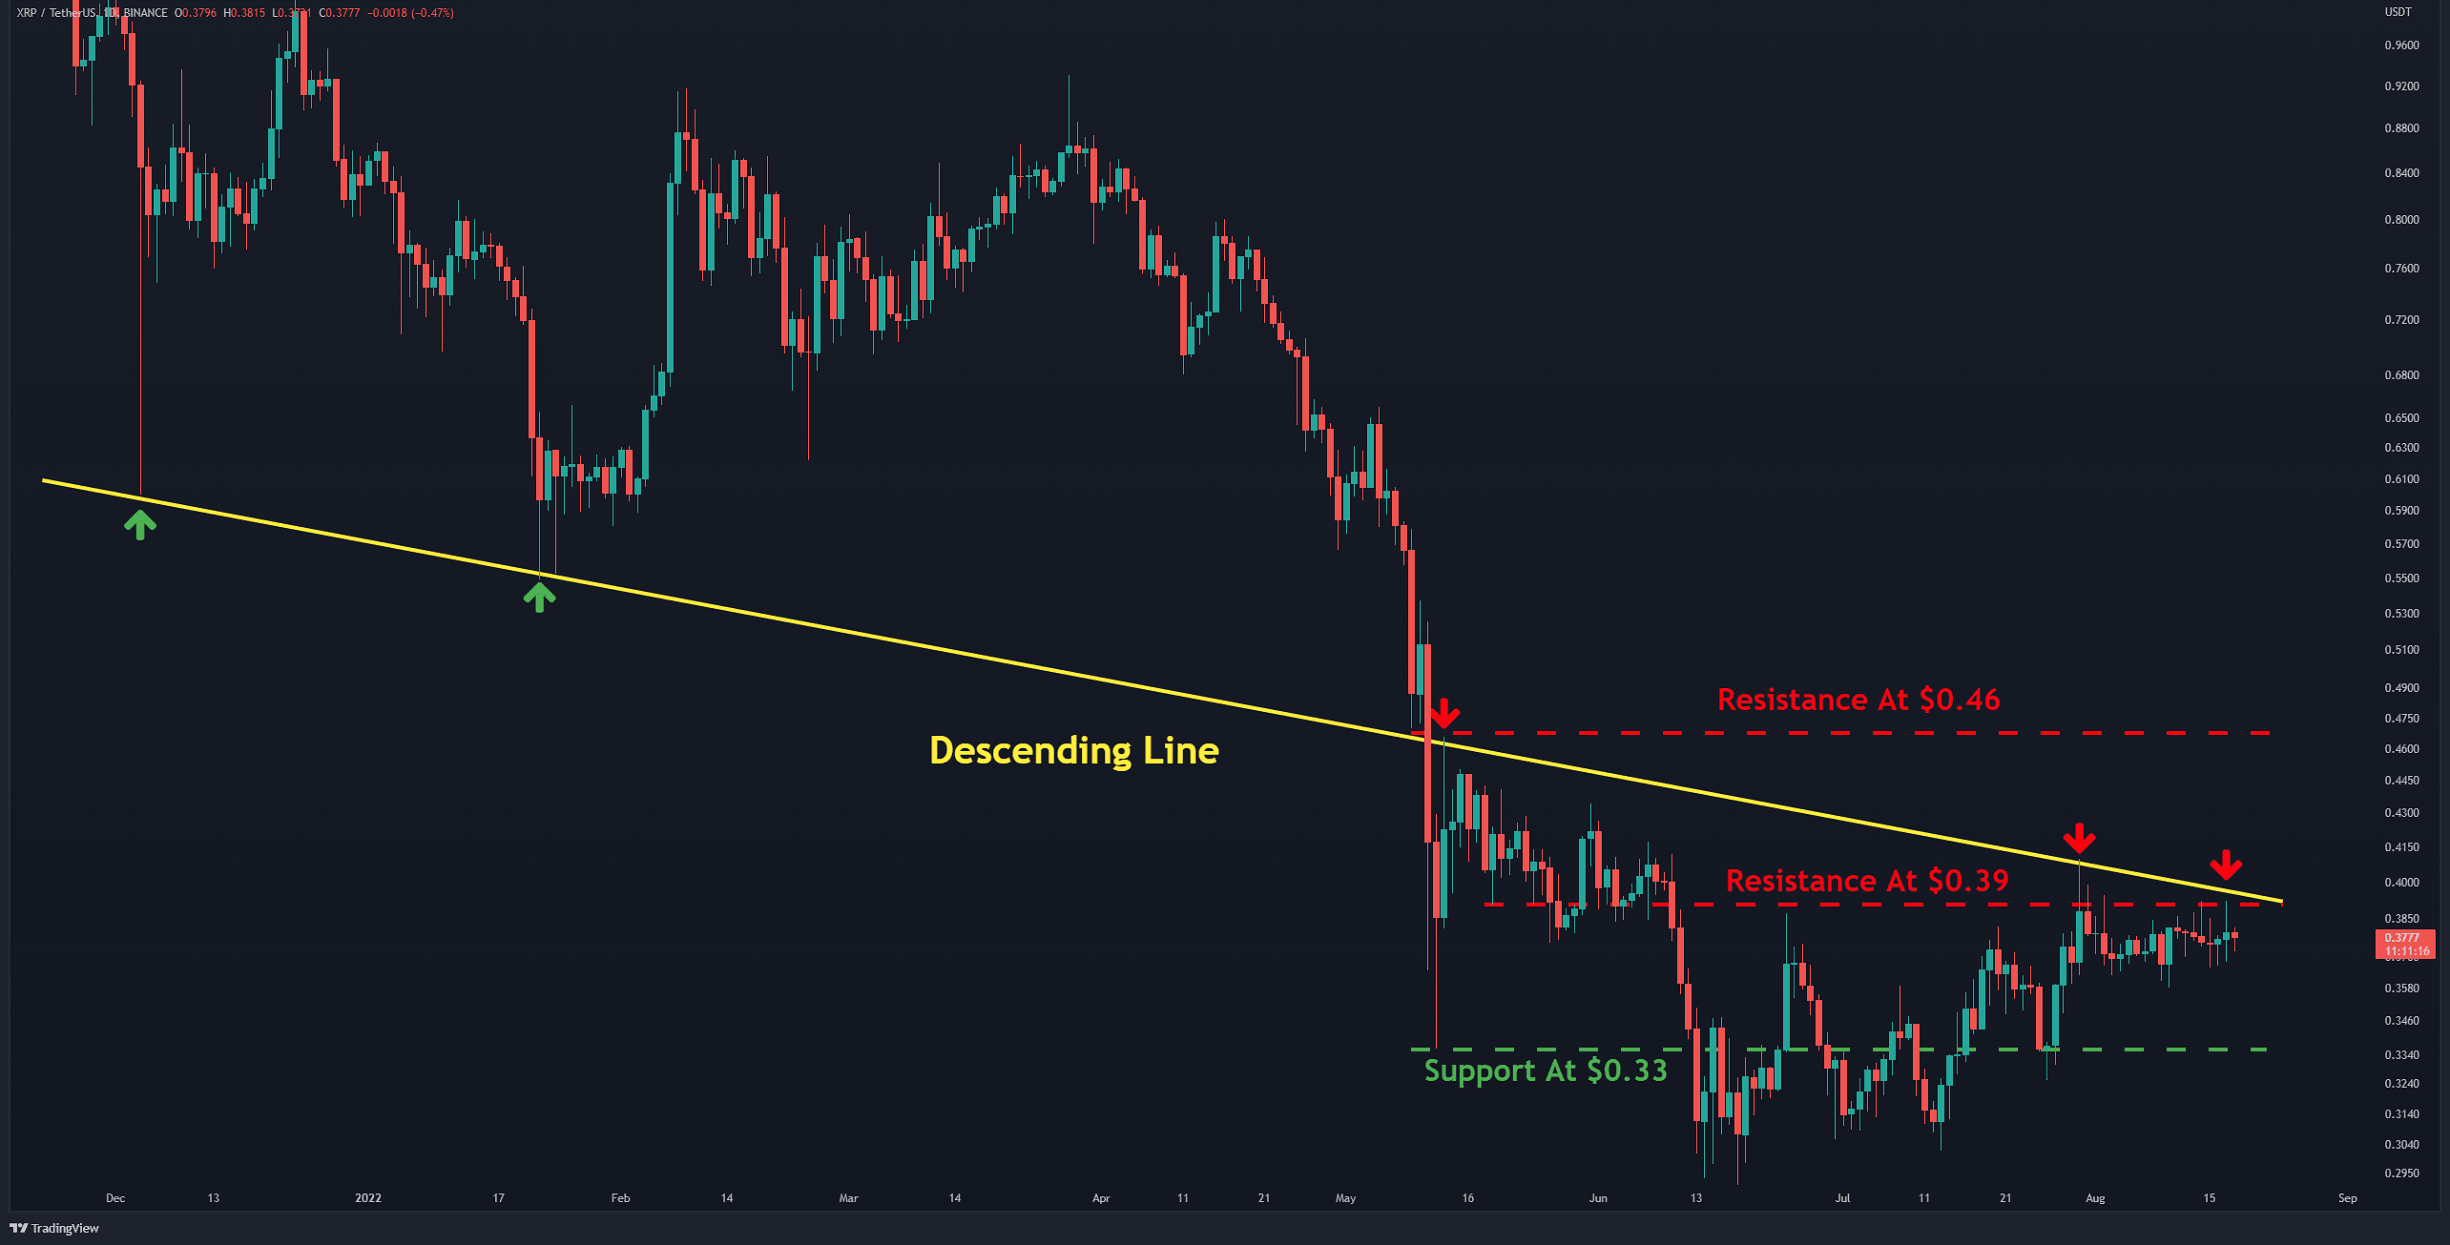
Ripple has been experiencing a sideways trend below the stiff resistance for nearly three weeks and has remained range-bound between 0.36$ and $0.39 for the largest part.
By Grizzly
It appears that neither side is able to take assert convincing dominance in the market for XRP. The bulls need to flip the horizontal resistance at $0.39 (in red) to start a rally. The intersection of this resistance with the descending line (in yellow) has created a relatively strong barrier.
Breaking this resistance could result in XRP charging at the subsequent target, which currently lies at $0.46. This would improve the overall structure and put bulls back on track. However, if the bears get the upper hand, the cryptocurrency could revisit the support at $0.33 (in green).
Key Support Levels: $0.33 & $0.28
Key Resistance Levels: $0.39 & $0.46
Daily Moving Averages:
MA20: $0.44
MA50: $0.71
MA100: $0.69
MA200: $0.48
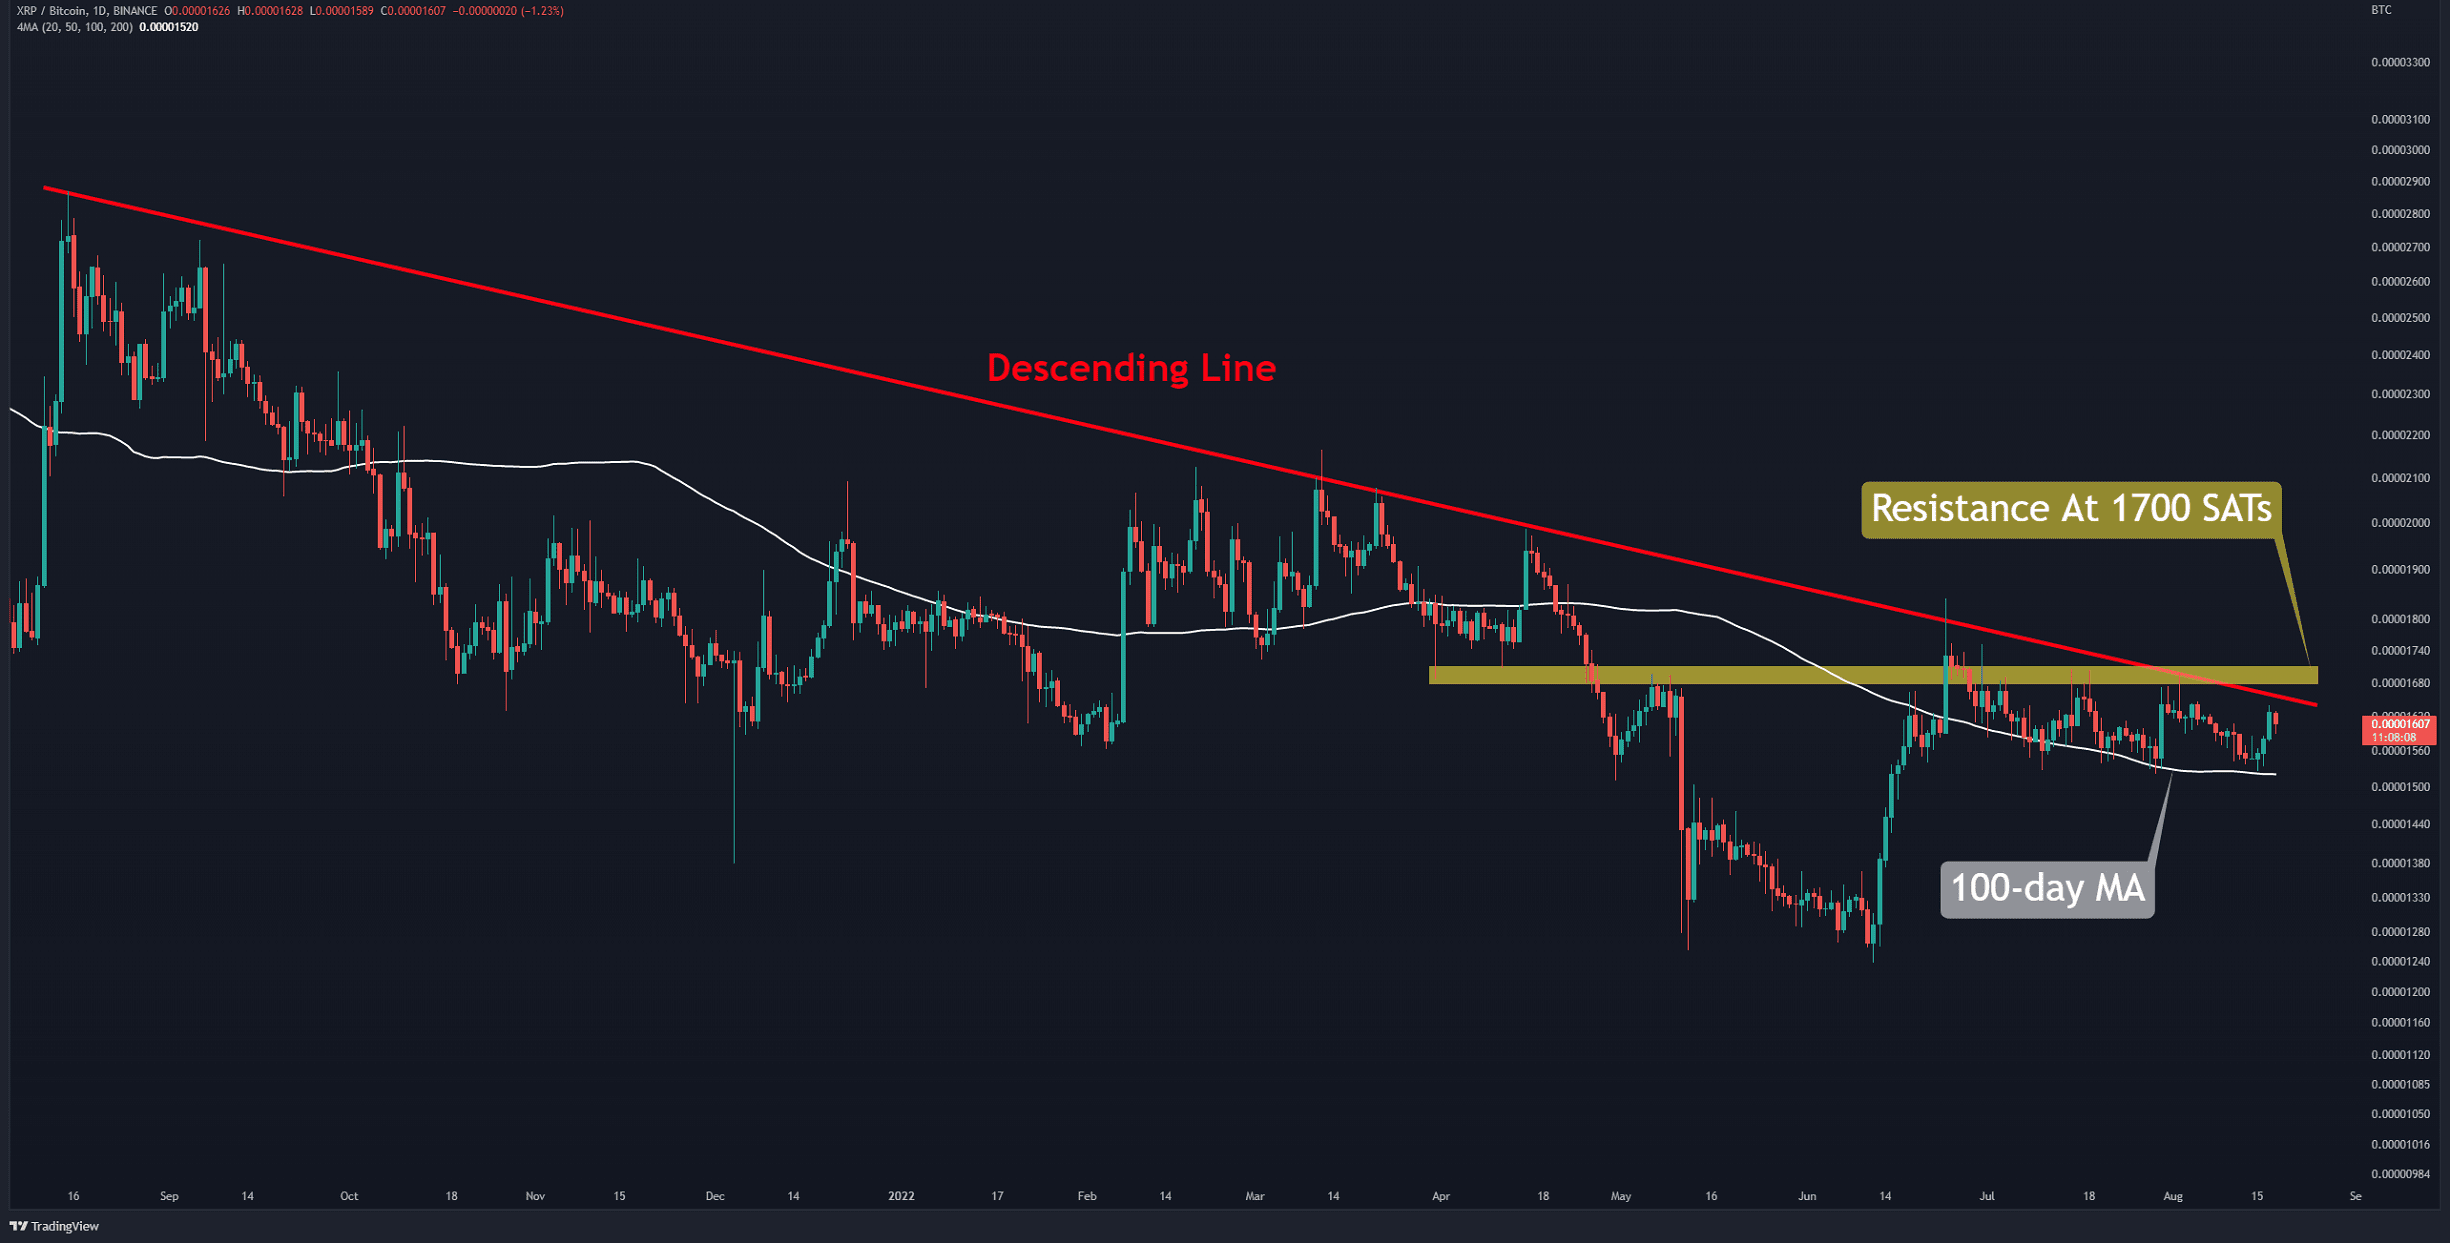
Against Bitcoin, the price is struggling with descending line resistance (in red) and horizontal resistance at 1700 SATs (in yellow). From the bottom side, the 100-day moving average (in white) acts as a support line. The structure is bearish in the short term as we can see both lower highs and lower lows taking place. A close below 1500 SATs will trigger a corrective wave. On the other hand, if the bulls push XRP above 1,700 SATs, it will probably extend to the next target at 2,000 SATs.
Key Support Levels: 1500 SATs & 1370 SATs
Key Resistance Levels: 1700 SATs & 2100 SATs