XRP/USD:
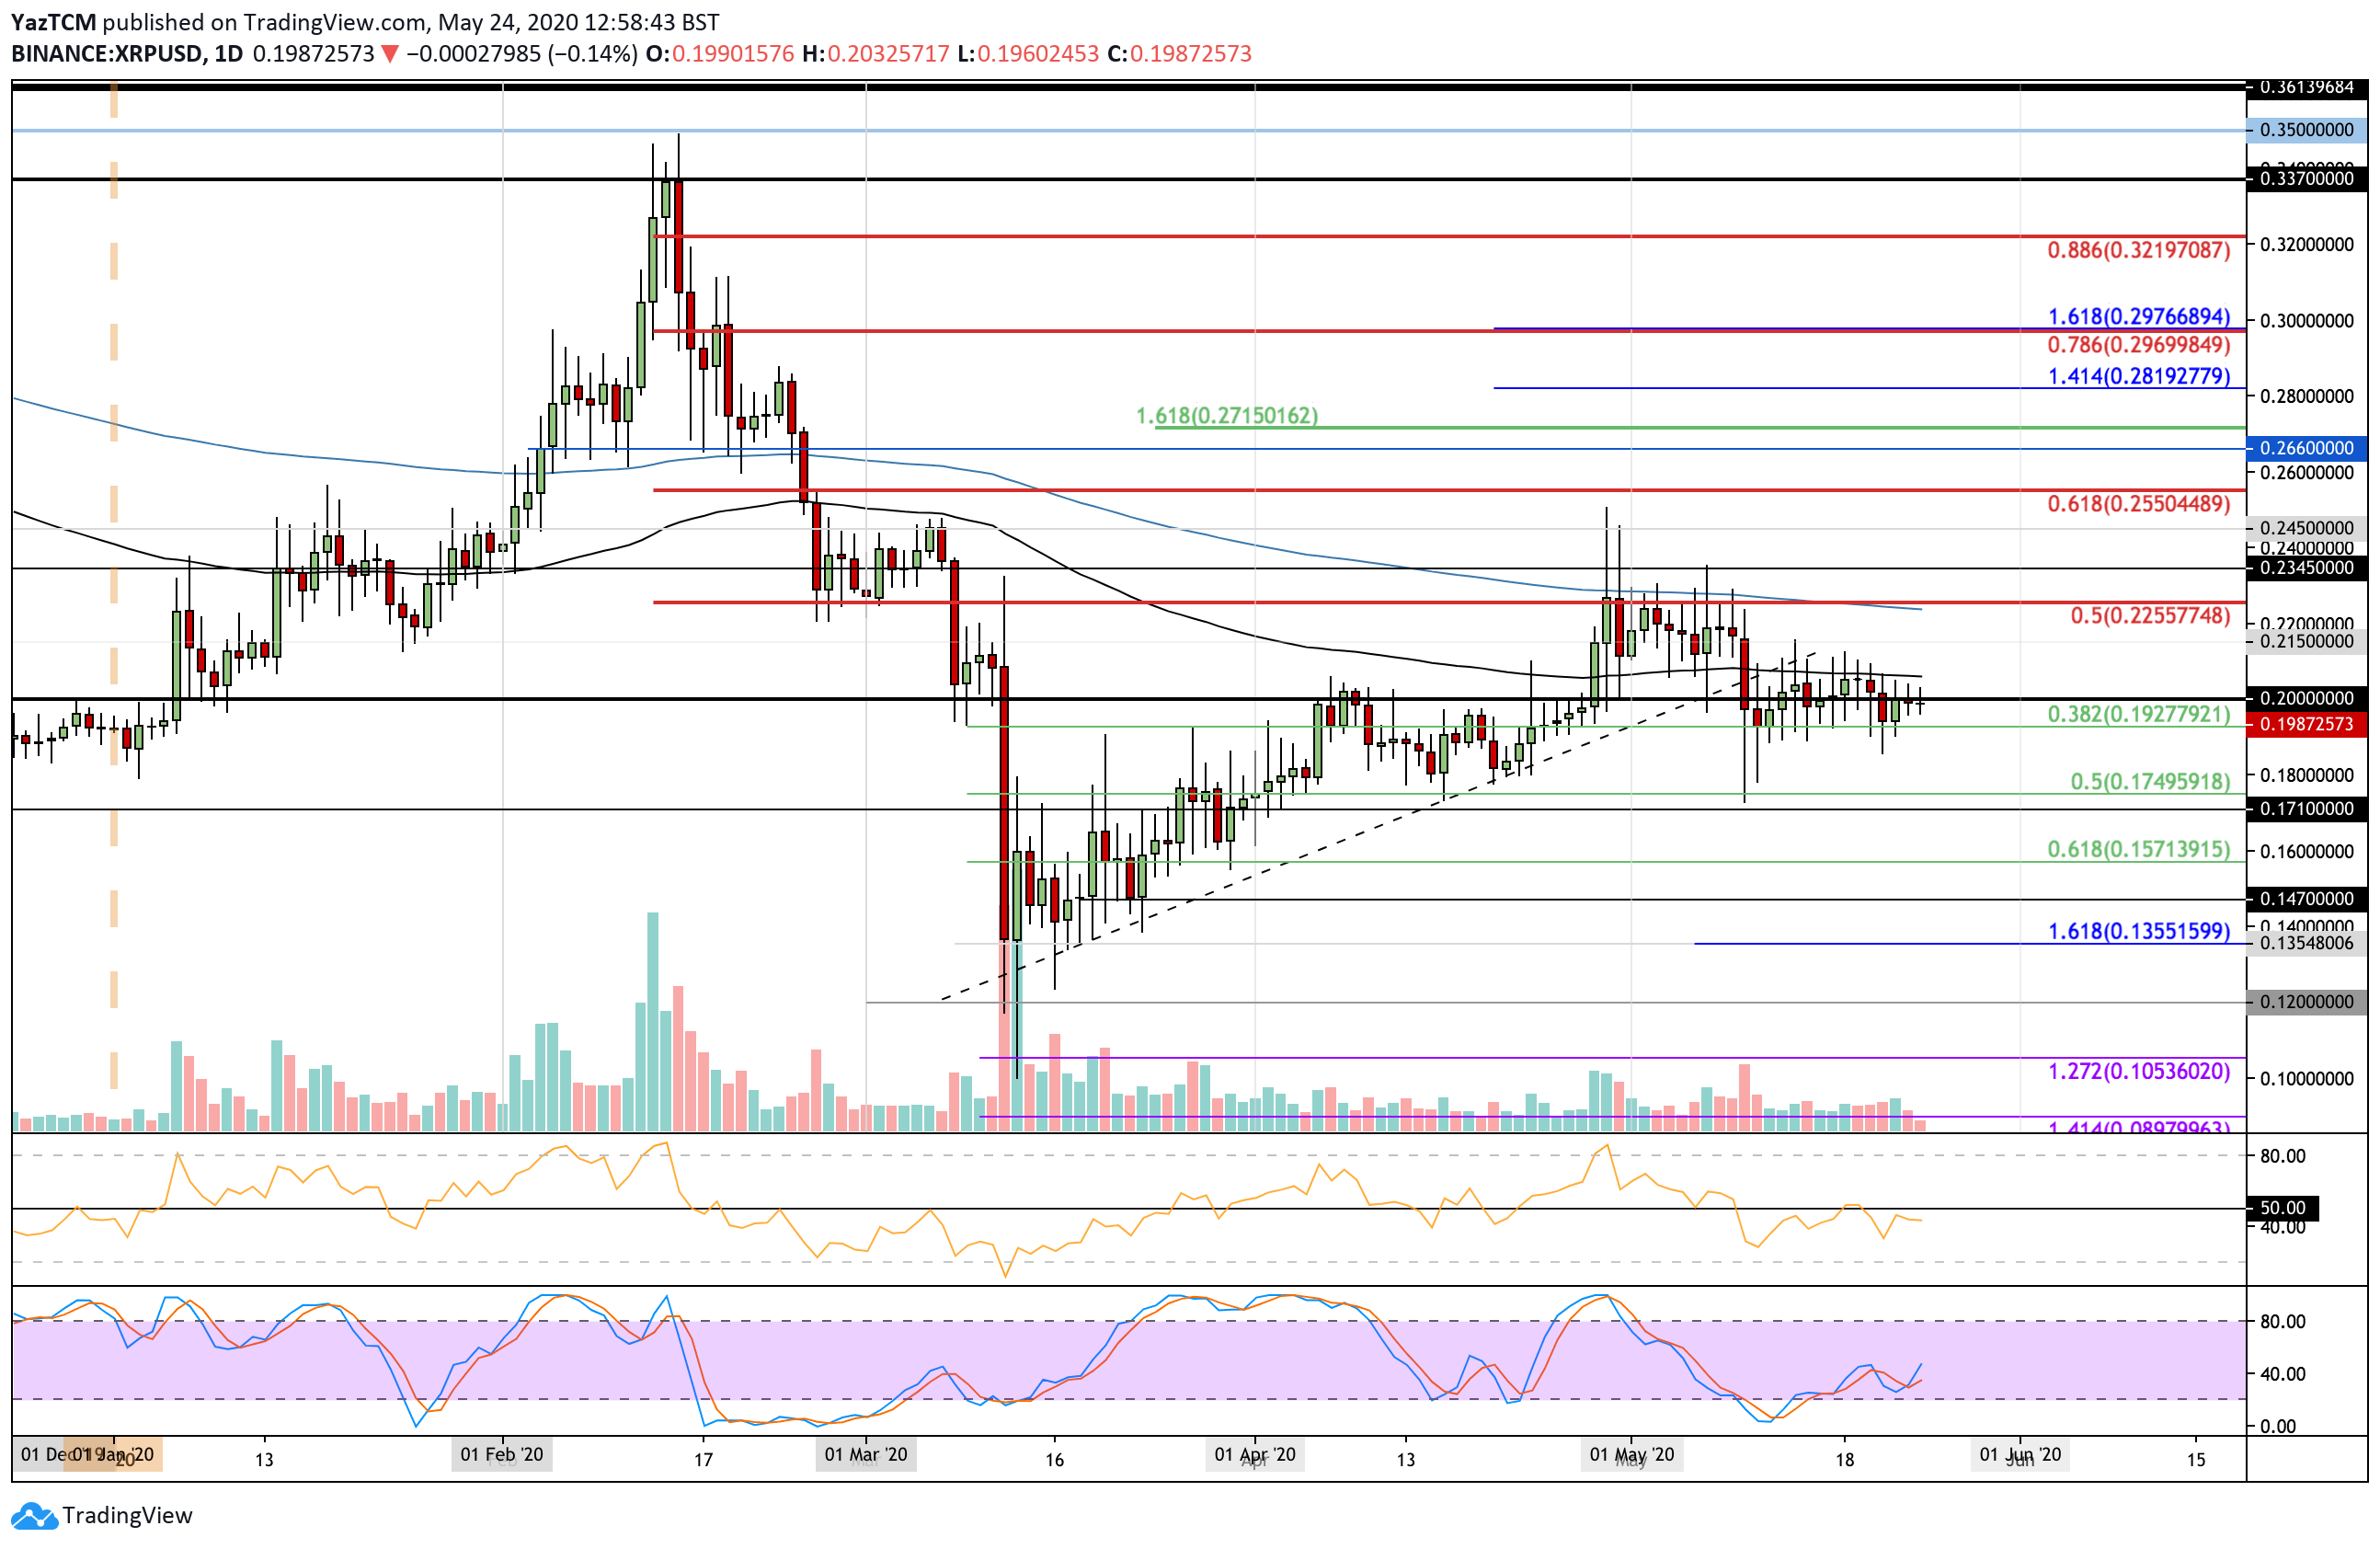
Support: $0.192, $0.18, $0.175.
Resistance: $0.207, $0.215, $0.225.
XRP/BTC:
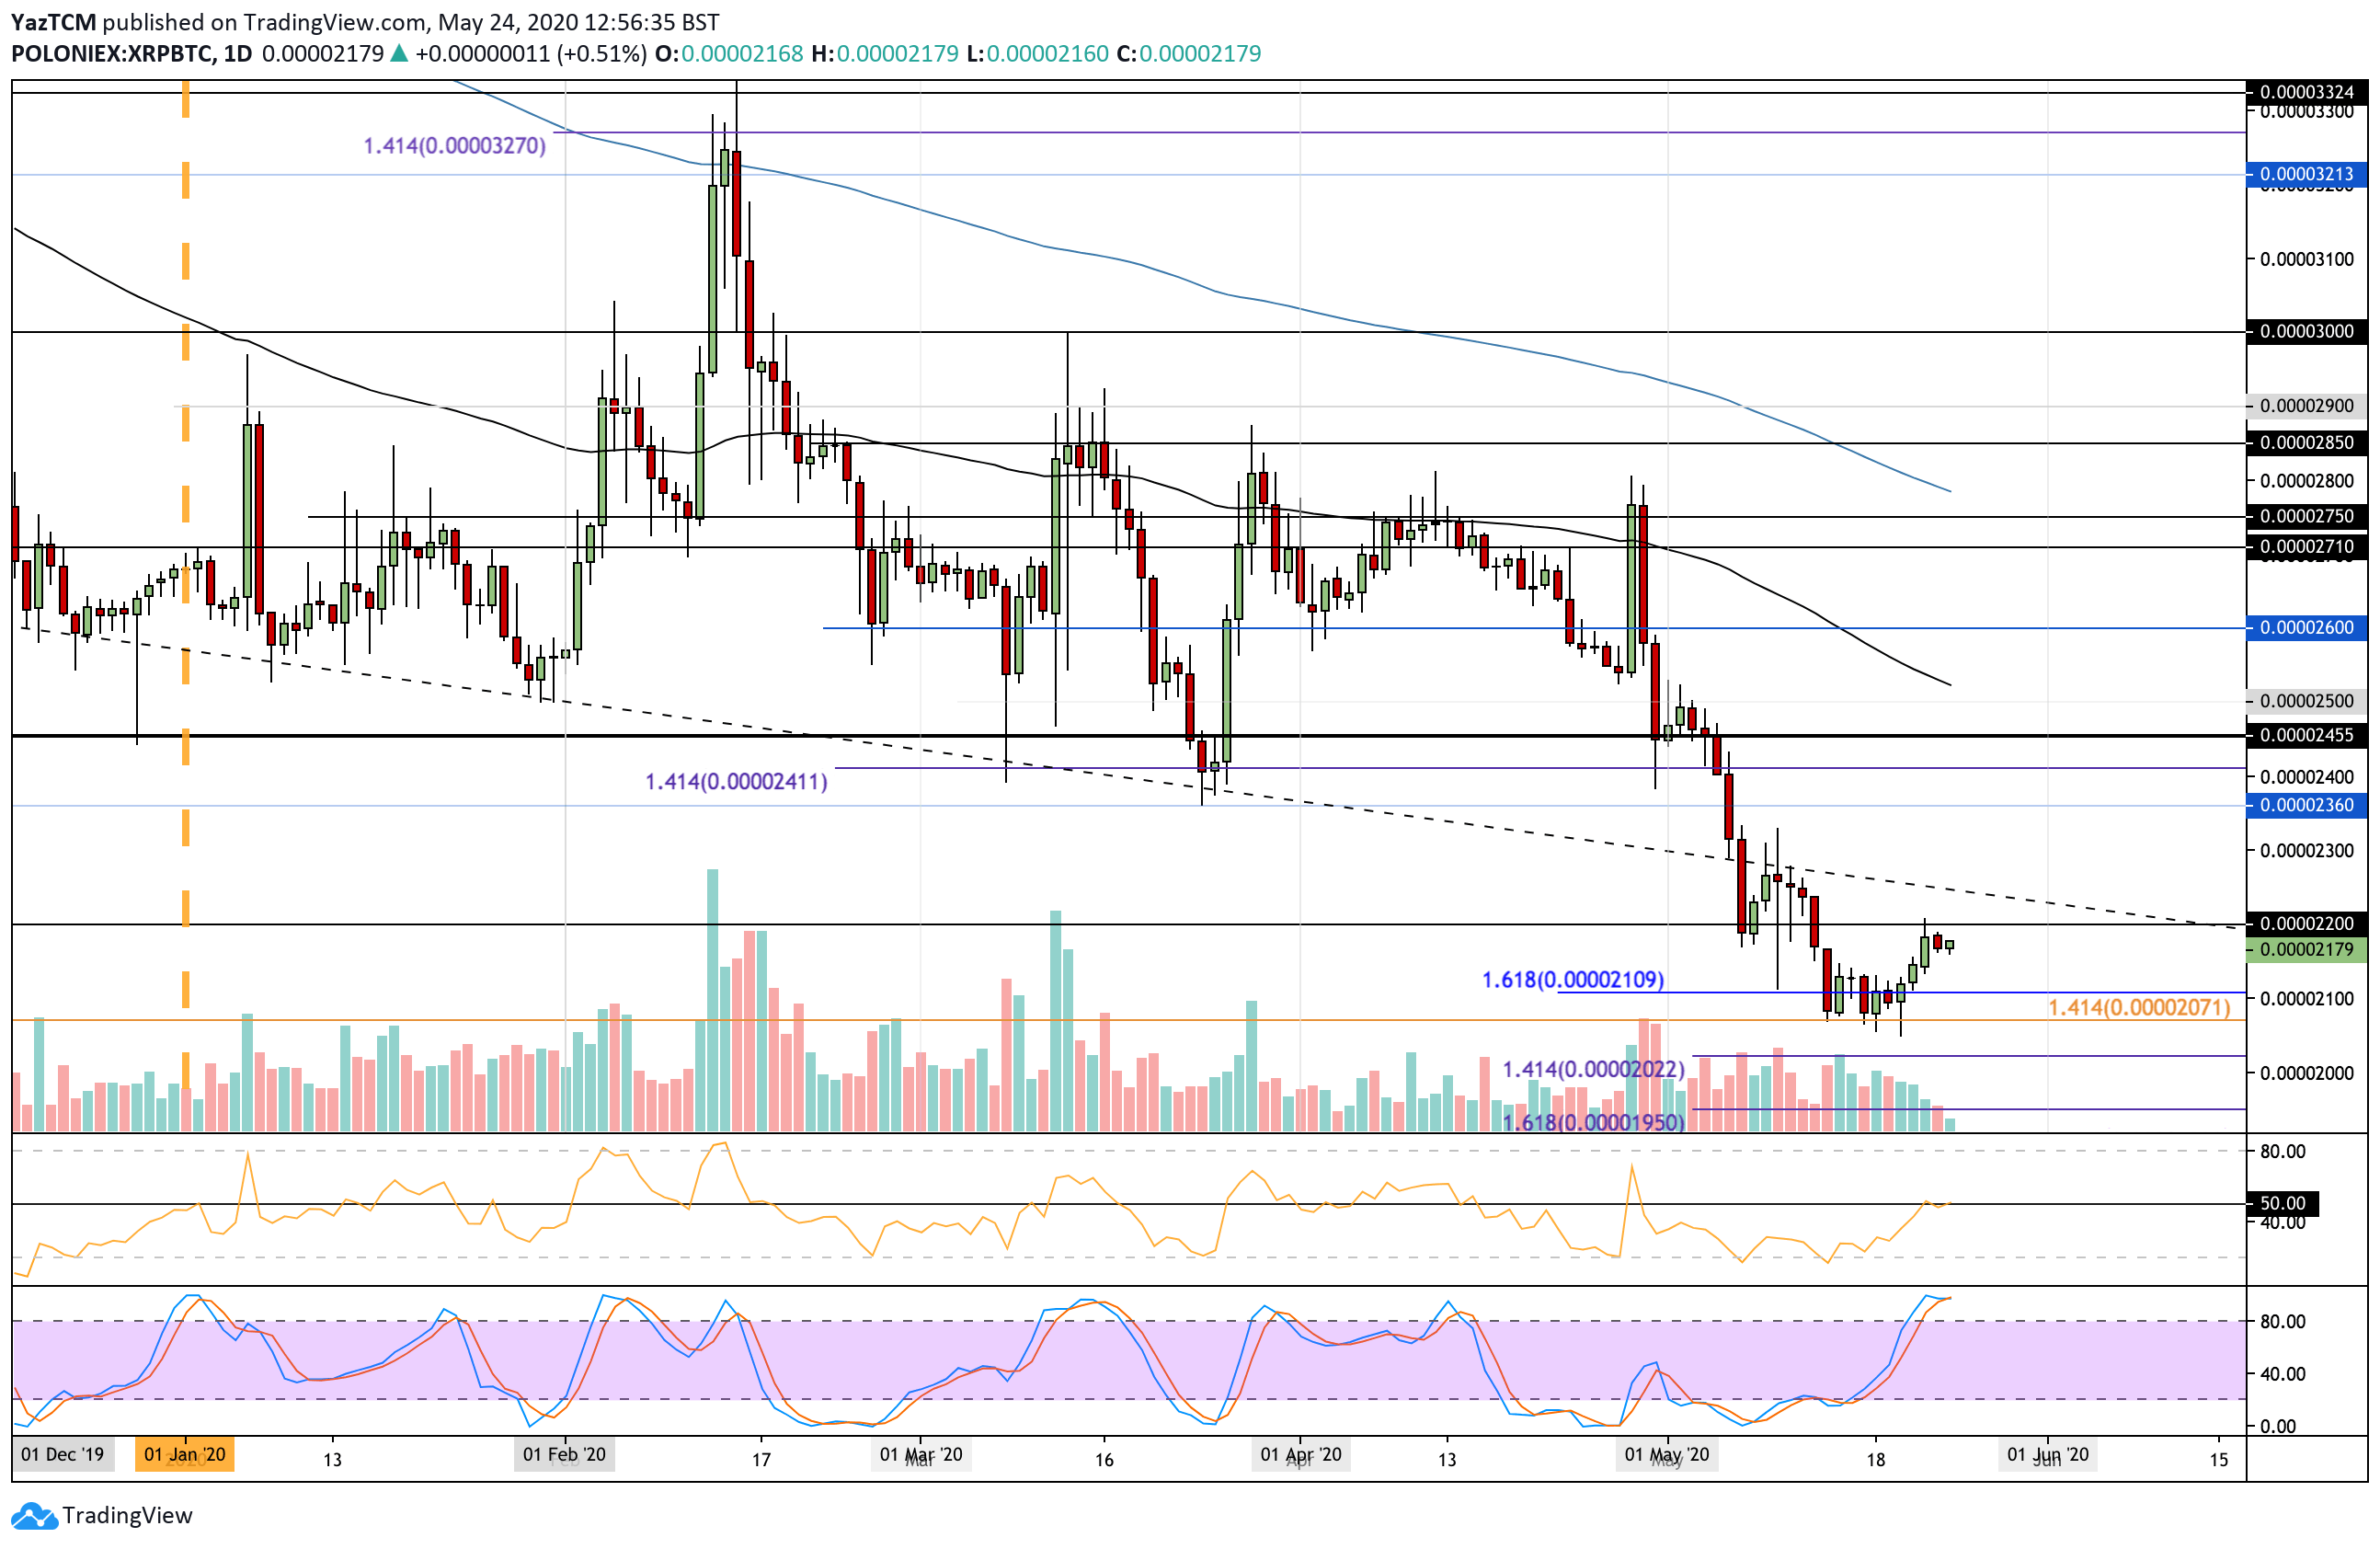
Support: 2100 SAT, 2070 SAT, 2022 SAT.
Resistance: 2200 SAT, 2300 SAT, 2360 SAT.
The break beneath $0.2 has caused XRP to lose its long-lasting number 3 rank on the top cryptocurrencies by market cap to the USDT stablecoin. XRP currently holds an $8.79 billion market cap value while Tether is holding an $8.8 billion market cap as it takes over XRP. The battle is still ongoing.
Since dropping beneath the 100-days EMA in May, XRP has failed to close back above the critical line for the past 14 days of trading. The coin has pretty much been trading sideways between $0.207 (100-days EMA) and $0.192 (.382 Fib Retracement) throughout this period. XRP must break this range to dictate the next direction.
If the sellers do push lower, the first level of support can be found at $0.192 (.382 Fib Retracement). This support has prevented the coin from closing lower for the entire month of May and is considered to be quite a strong level. Beneath this, support lies at $0.18, $0.175 (.5 Fib Retracement level), and $0.171.
Further support is located at $0.157 (.618 Fib Retracement) and $0.147.
On the other hand, if the buyers can reclaim $0.2, the first level of strong resistance lies at $0.207 (100-days EMA). Above this, resistance is expected at $0.215, $0.225 (bearish .5 Fib Retracement & 200-days EMA), and $0.235.
The RSI is slightly beneath the 50 level, which shows weak bearish momentum within the market. If the RSI continues to fall, then XRP can be expected to drop into the $0.192 support or perhaps even below it.
Against Bitcoin, XRP is starting to look promising after being able to rebound from the 2-year low at the 2070 SAT level, earlier this week. The coin broke above the 2100 SAT level and has continued higher to edge toward the 2200 level as it currently trades at 2180 SAT.
A break beyond 2200 SAT should send XRP to push higher and head toward the May highs around 2500 SAT.
Once the buyers break 2200 SAT, resistance is located at 2300 SAT, 2360 SAT, and 2400 SAT. Further resistance is found at 2455 SAT, 2500 SAT, and 2600 SAT.
On the other hand, if the sellers push lower again, the first level of support is expected at 2100 SAT. Beneath this, support lies at 2070 SAT, 2022 SAT, and 1950 SAT.
The RSI is now trading at the 50 levels to indicate indecision within the market.