After the bulls pushed the price by 34% from the lowest mark in June, they retreated after reaching the first resistance zone. Ripple has spent the previous four days in red and has lost about 13% of its value as of this writing.
By Grizzly
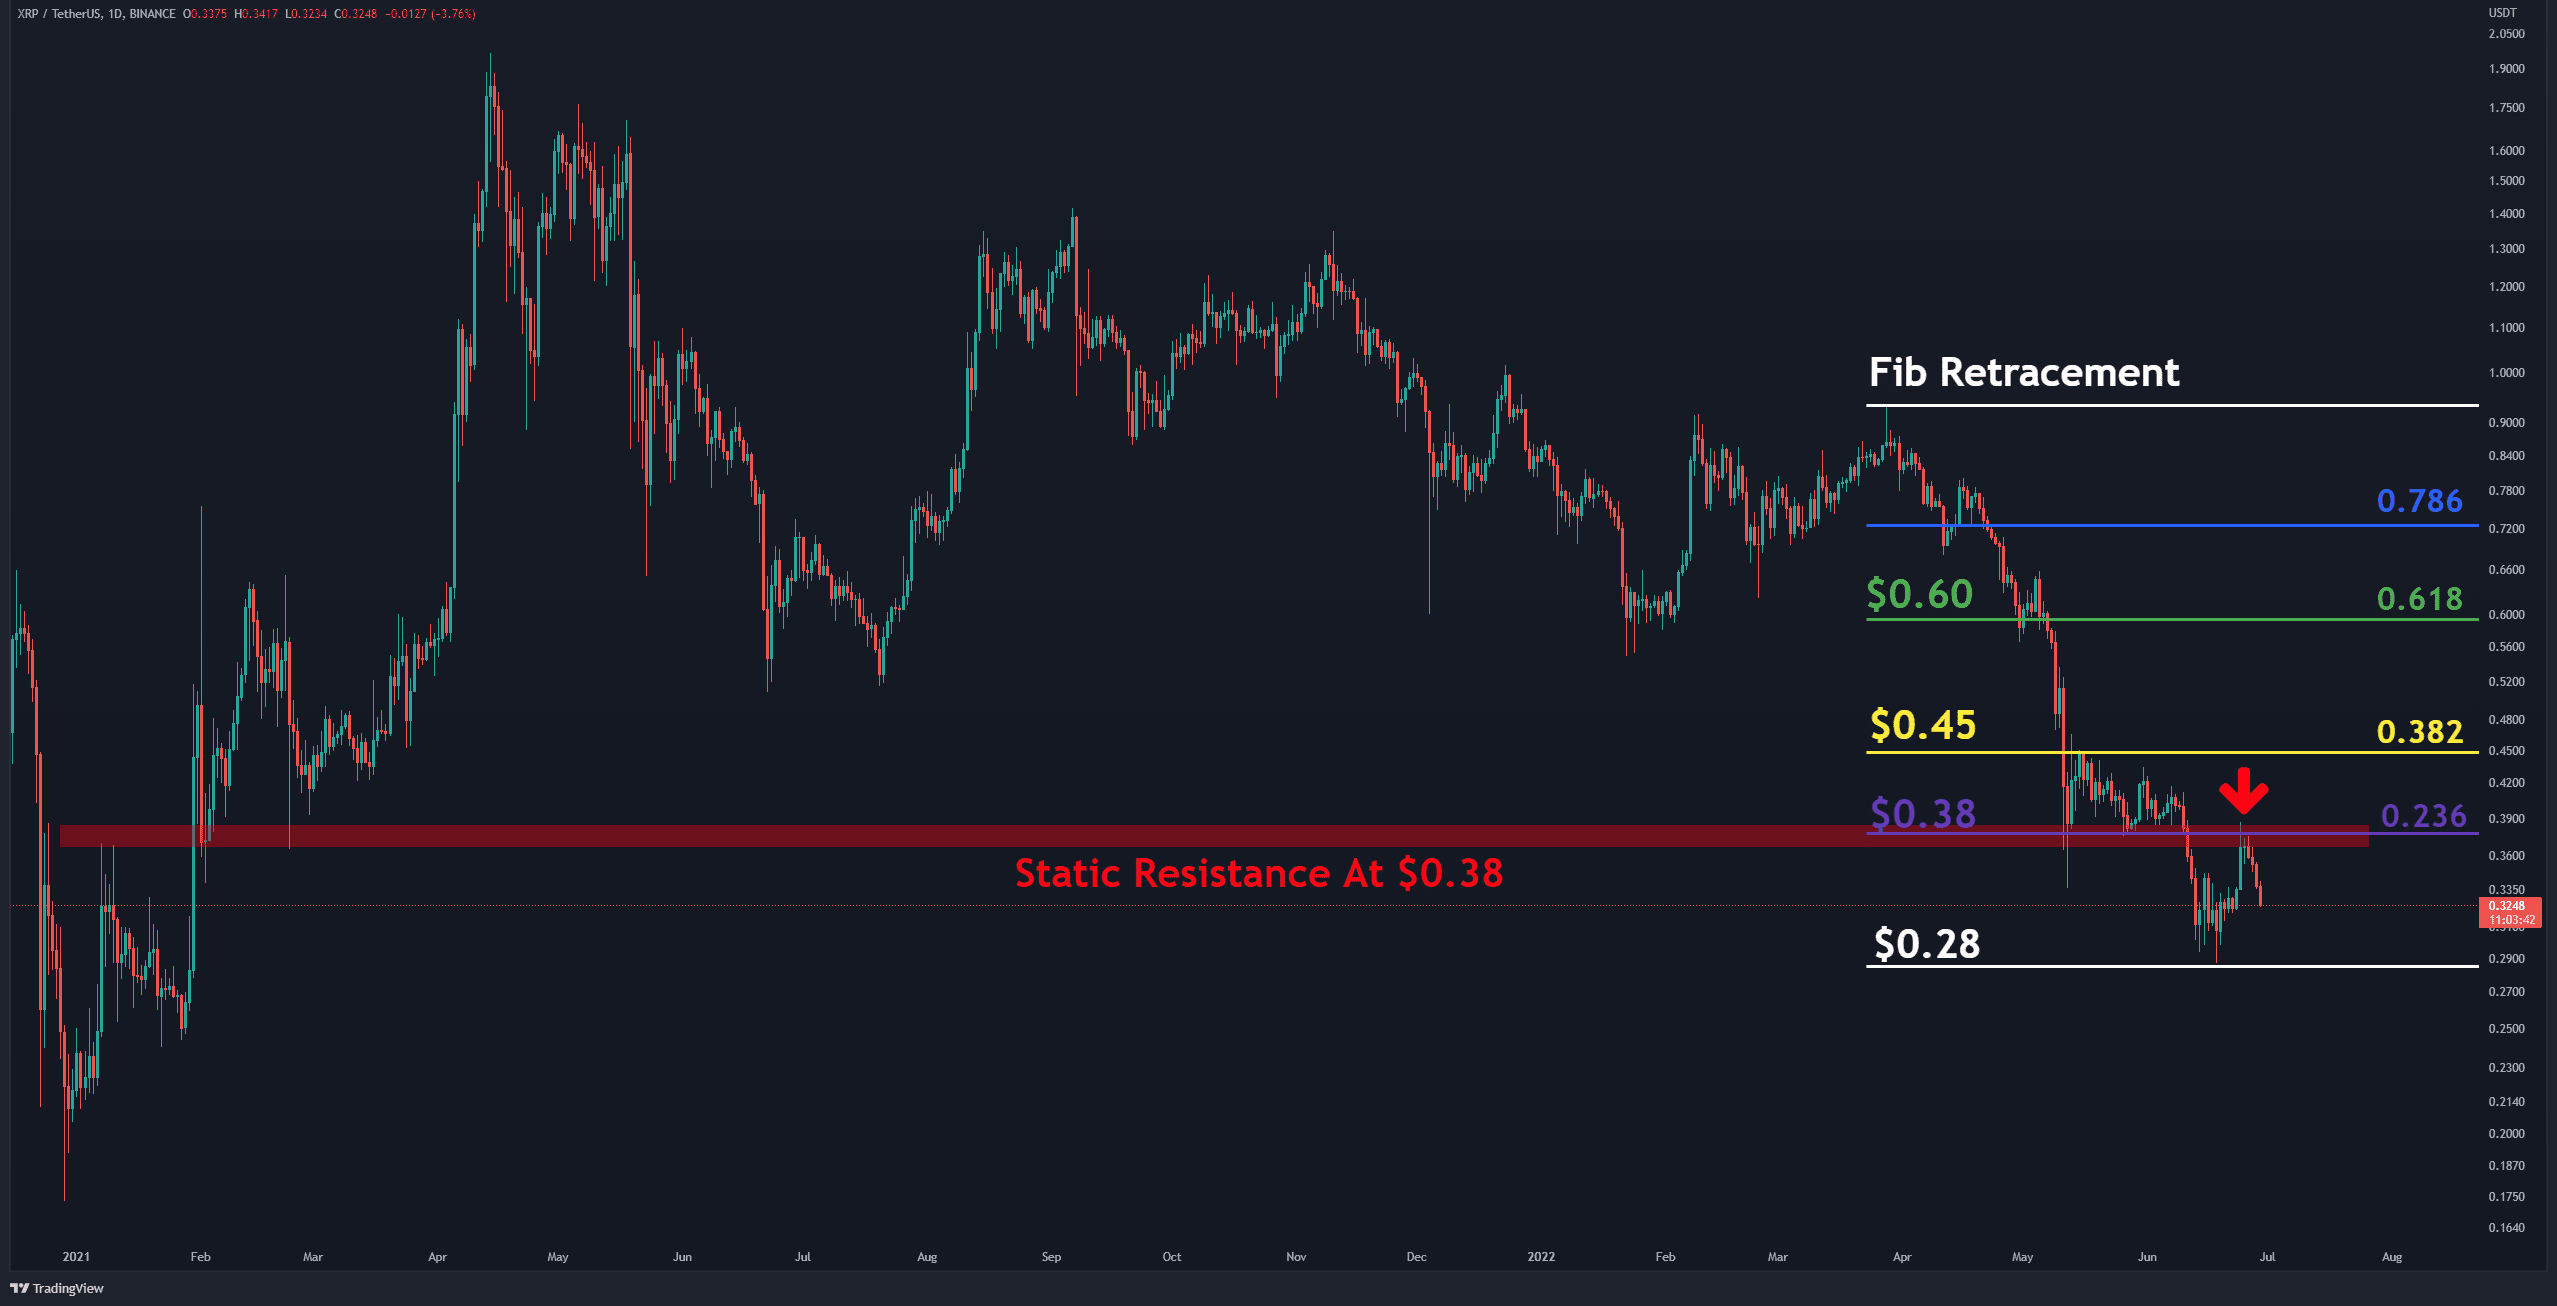
On the daily timeframe, the intersection of the Fibonacci level at 0.236 (in purple) with the horizontal resistance at $0.38 (in red) has formed a supply zone. Given the mentioned structure, if the bears fail to push the price below $0.3, forming a higher bottom, the recent move is more likely to constitute a short-term correction.
But if this correction gets stretched below $0.3, then the end of the short-term uptrend would be confirmed. Furthermore, the RSI 14d indicator, entering the bullish zone with a sharp movement, changed direction after reaching the baseline (in white) and is gaining momentum in the bearish zone.
On the other hand, if buyers can form a higher high above $0.38, then one can expect the recent downtrend, which started in early April, to have halted for the mid-term.
Key Support Levels: $0.30 & $0.24
Key Resistance Levels: $0.38 & $0.45
Moving Averages:
MA20: $0.33
MA50: $0.38
MA100: $0.55
MA200: $0.80
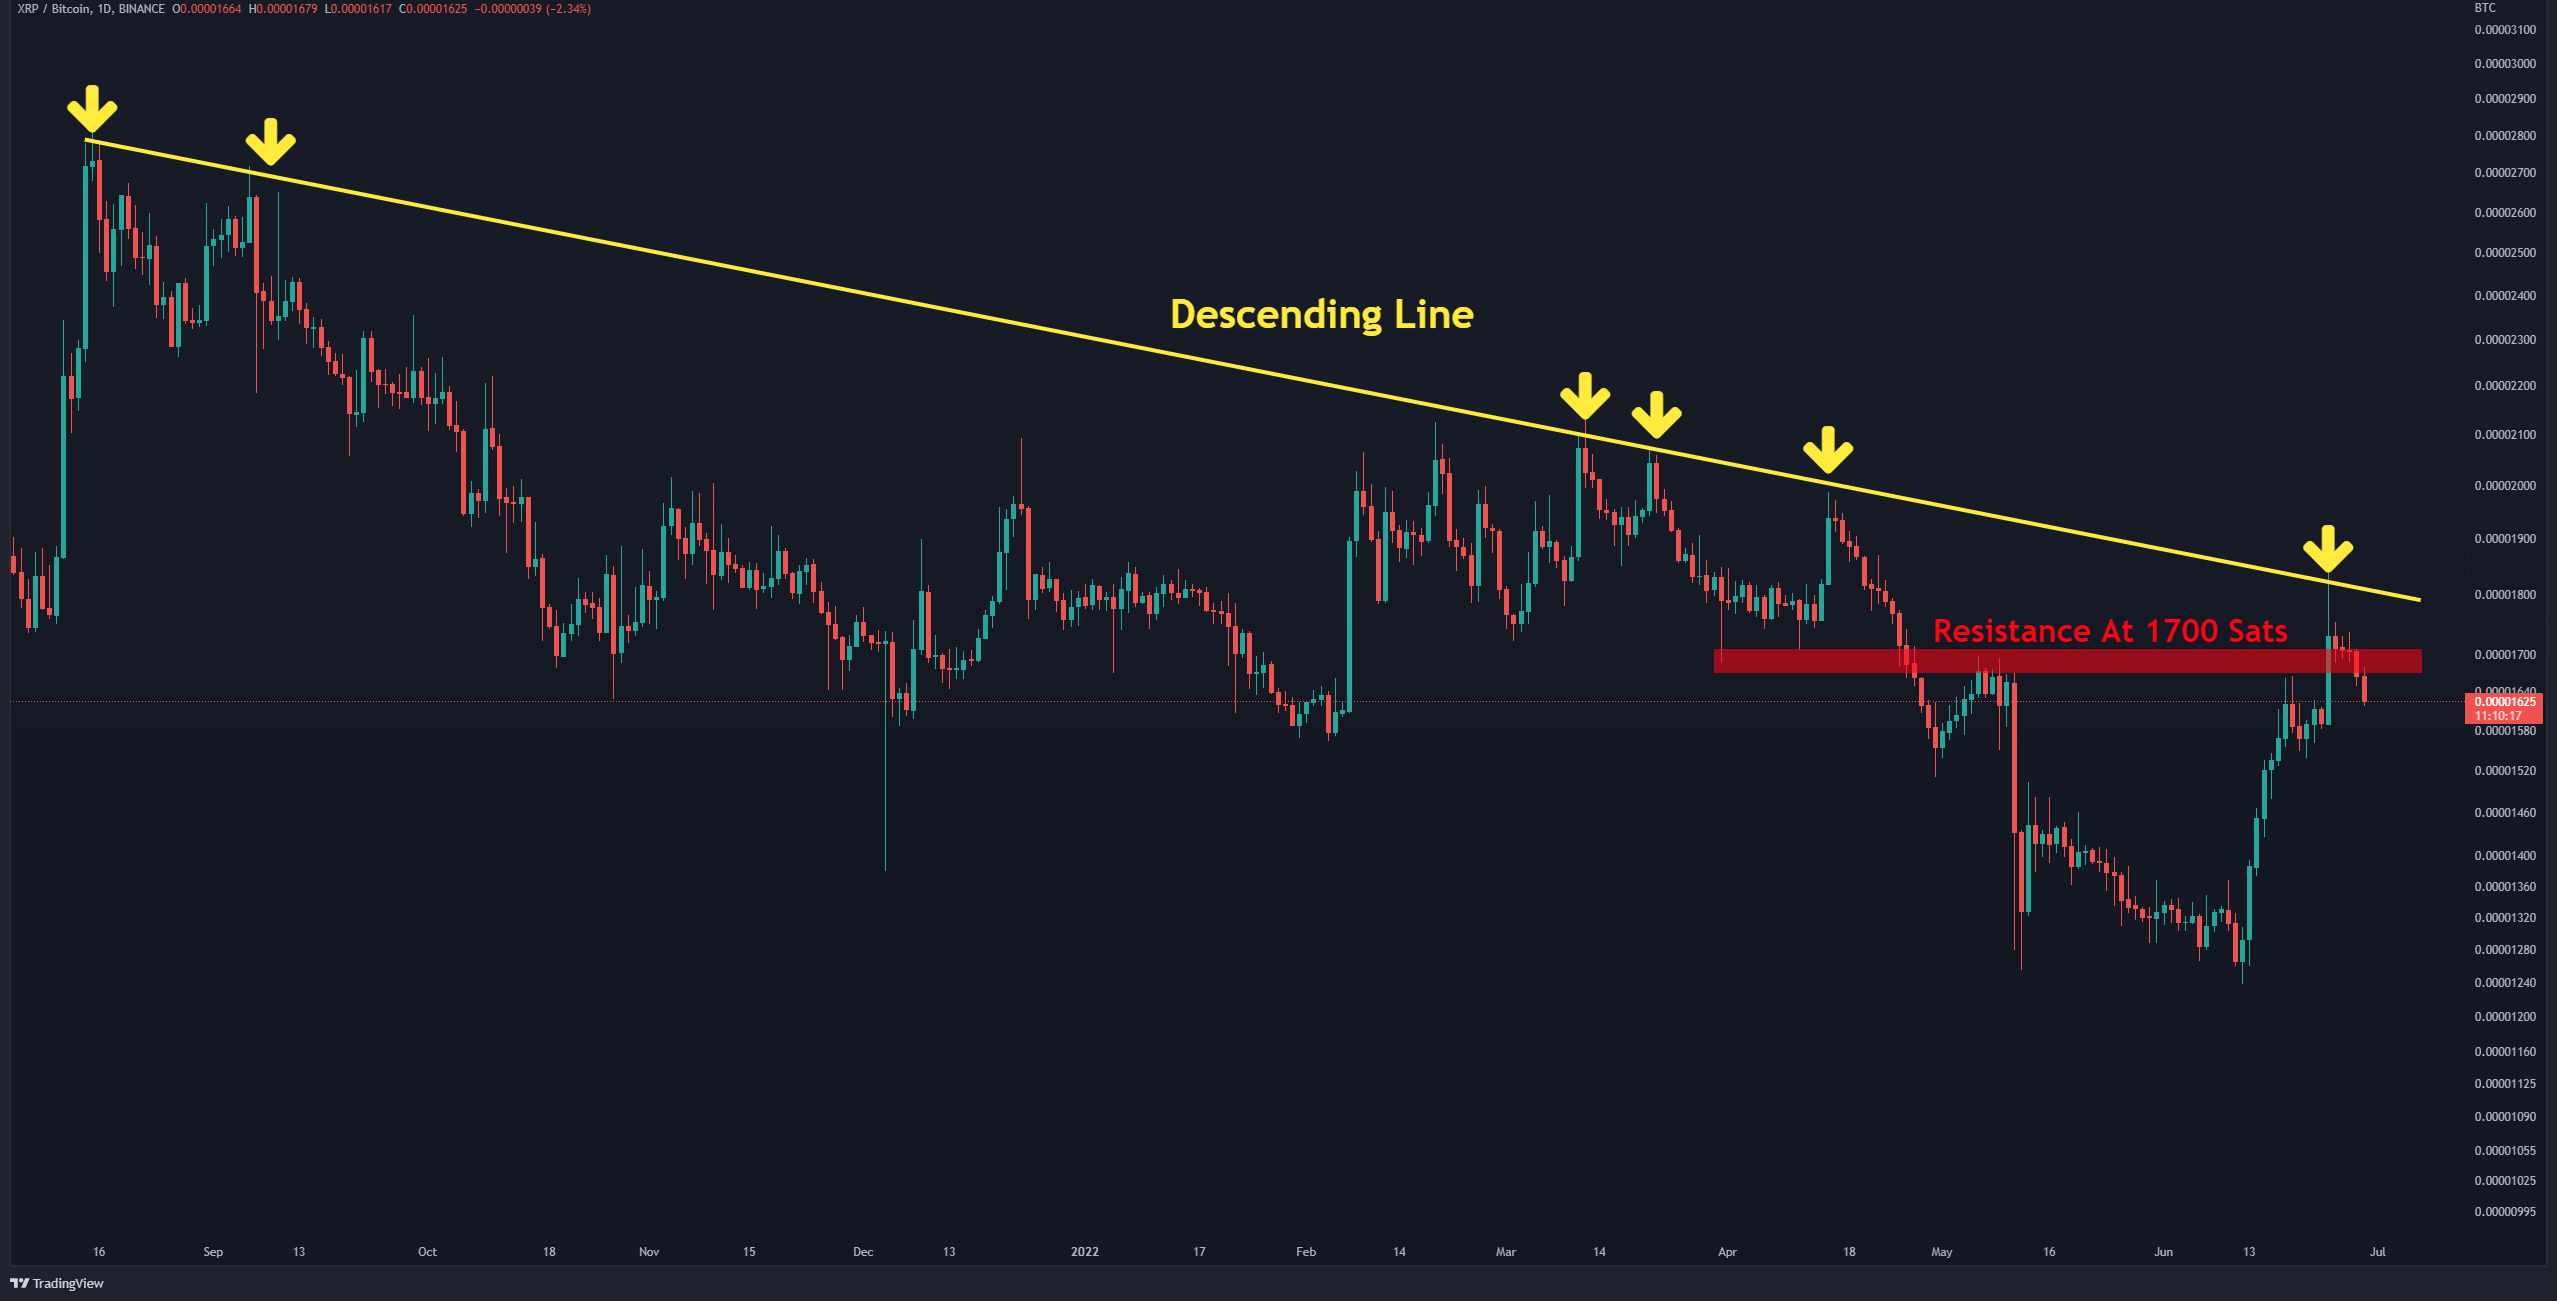
Against Bitcoin, XRP did not continue to move up after reaching the descending line (in yellow). This reversal can be considered a fake breakout above the static level at 1700 Sats (in red). Due to the long upper shadow on June 24, the selling pressure is high in the 1700-1800 Sats range. If buyers manage to keep the price above the support at 1500 Sats, this move can be considered a healthy correction.
Key Support Levels: 1500 Sats & 1250 Sats
Key Resistance Levels: 1700 Sats & 1800 Sats