XRP’s price has shown signs of weakness recently. It was rejected significantly against USDT and formed a fake bullish breakout against BTC.
By: Edris
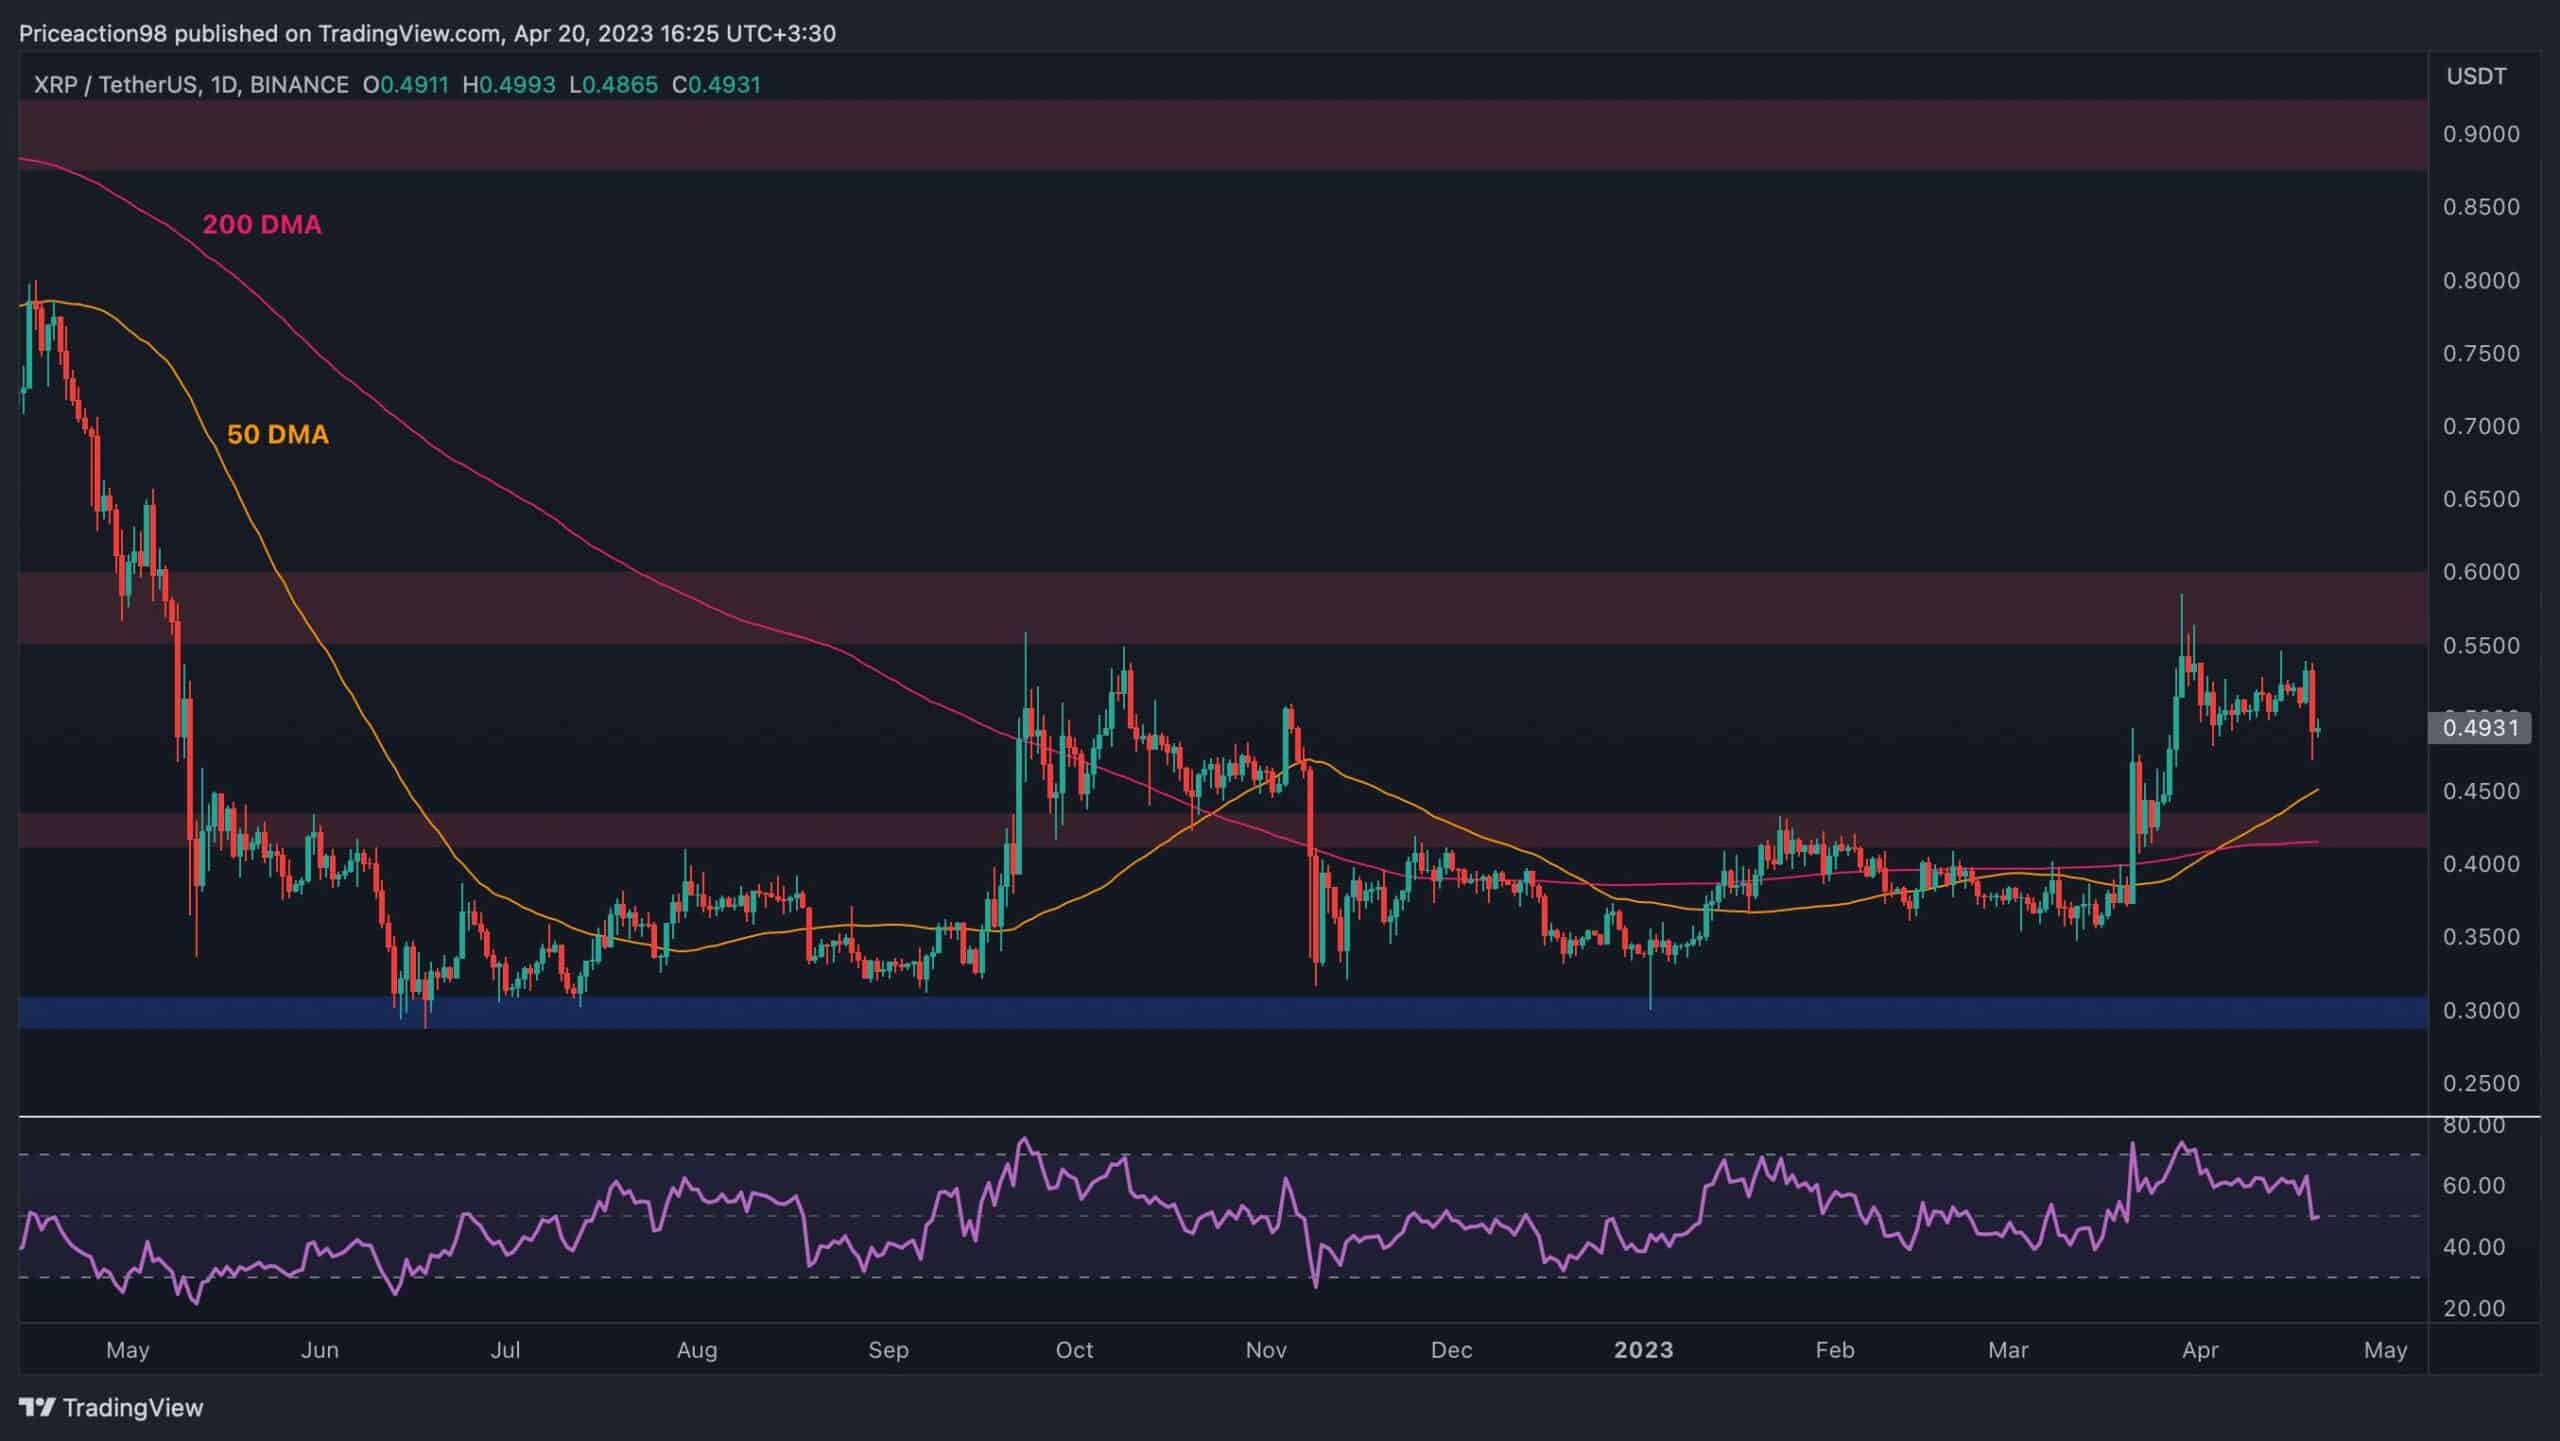
Looking at the USDT chart, it’s clear that the price has been decisively rejected to the downside from the $0.60 resistance level.
The 50-day moving average is the first potential support level, around the $0.45 mark. This is closely followed by the $0.43 static resistance level and the key 200-day moving average, both located around the same price. While there are strong support levels, the recent bearish rejection could still be worrisome for the bulls.
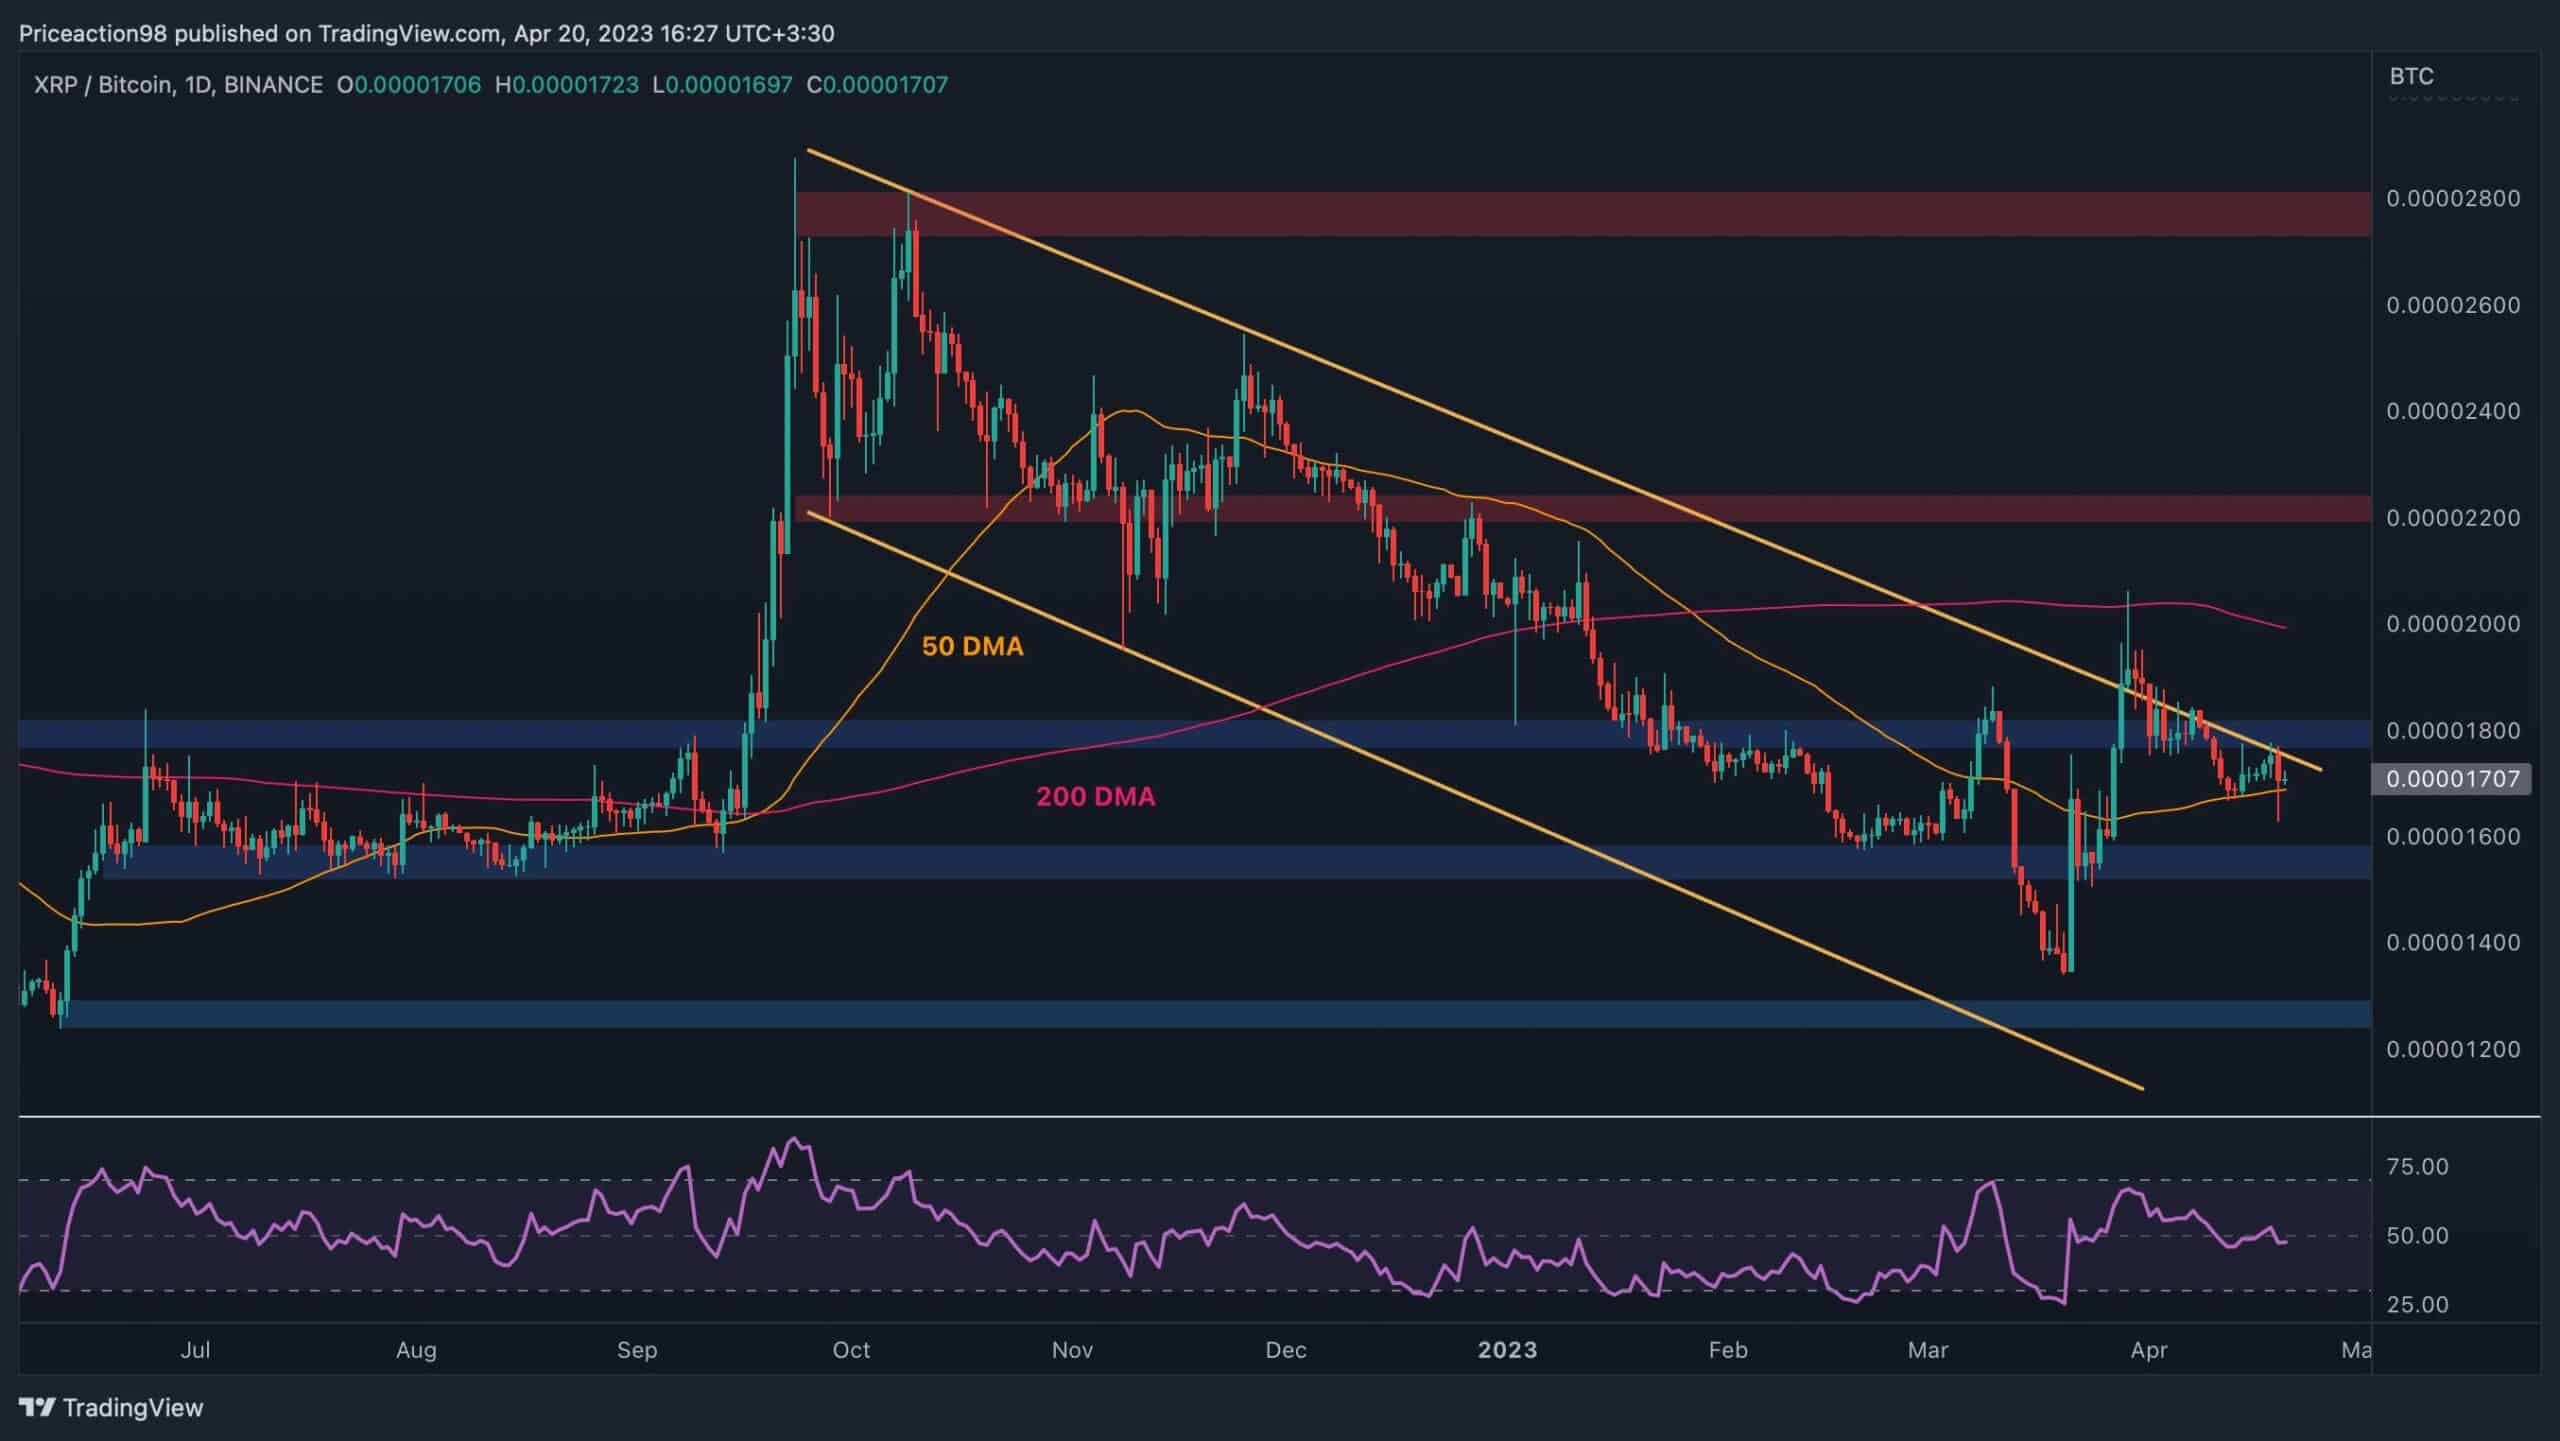
Moving on to the BTC chart, it’s evident that XRP has repeatedly failed to break above the large descending channel pattern. It was even rejected from the 200-day moving average on the first try and dropped back into the channel, creating a fake bullish breakout.
However, the 50-day moving average is currently providing support around the 0.000017 SAT mark. Both the higher boundary of the channel and the 0.000018 SAT resistance level are trying to push the market further down. If the 50-day moving average fails, the 0.000016 SAT support area would be the next key level.
On the other hand, a bullish breakout from the channel would cause the price to target the 200-day moving average once more in the short term, located around the significant psychological 0.00002 SAT resistance level.