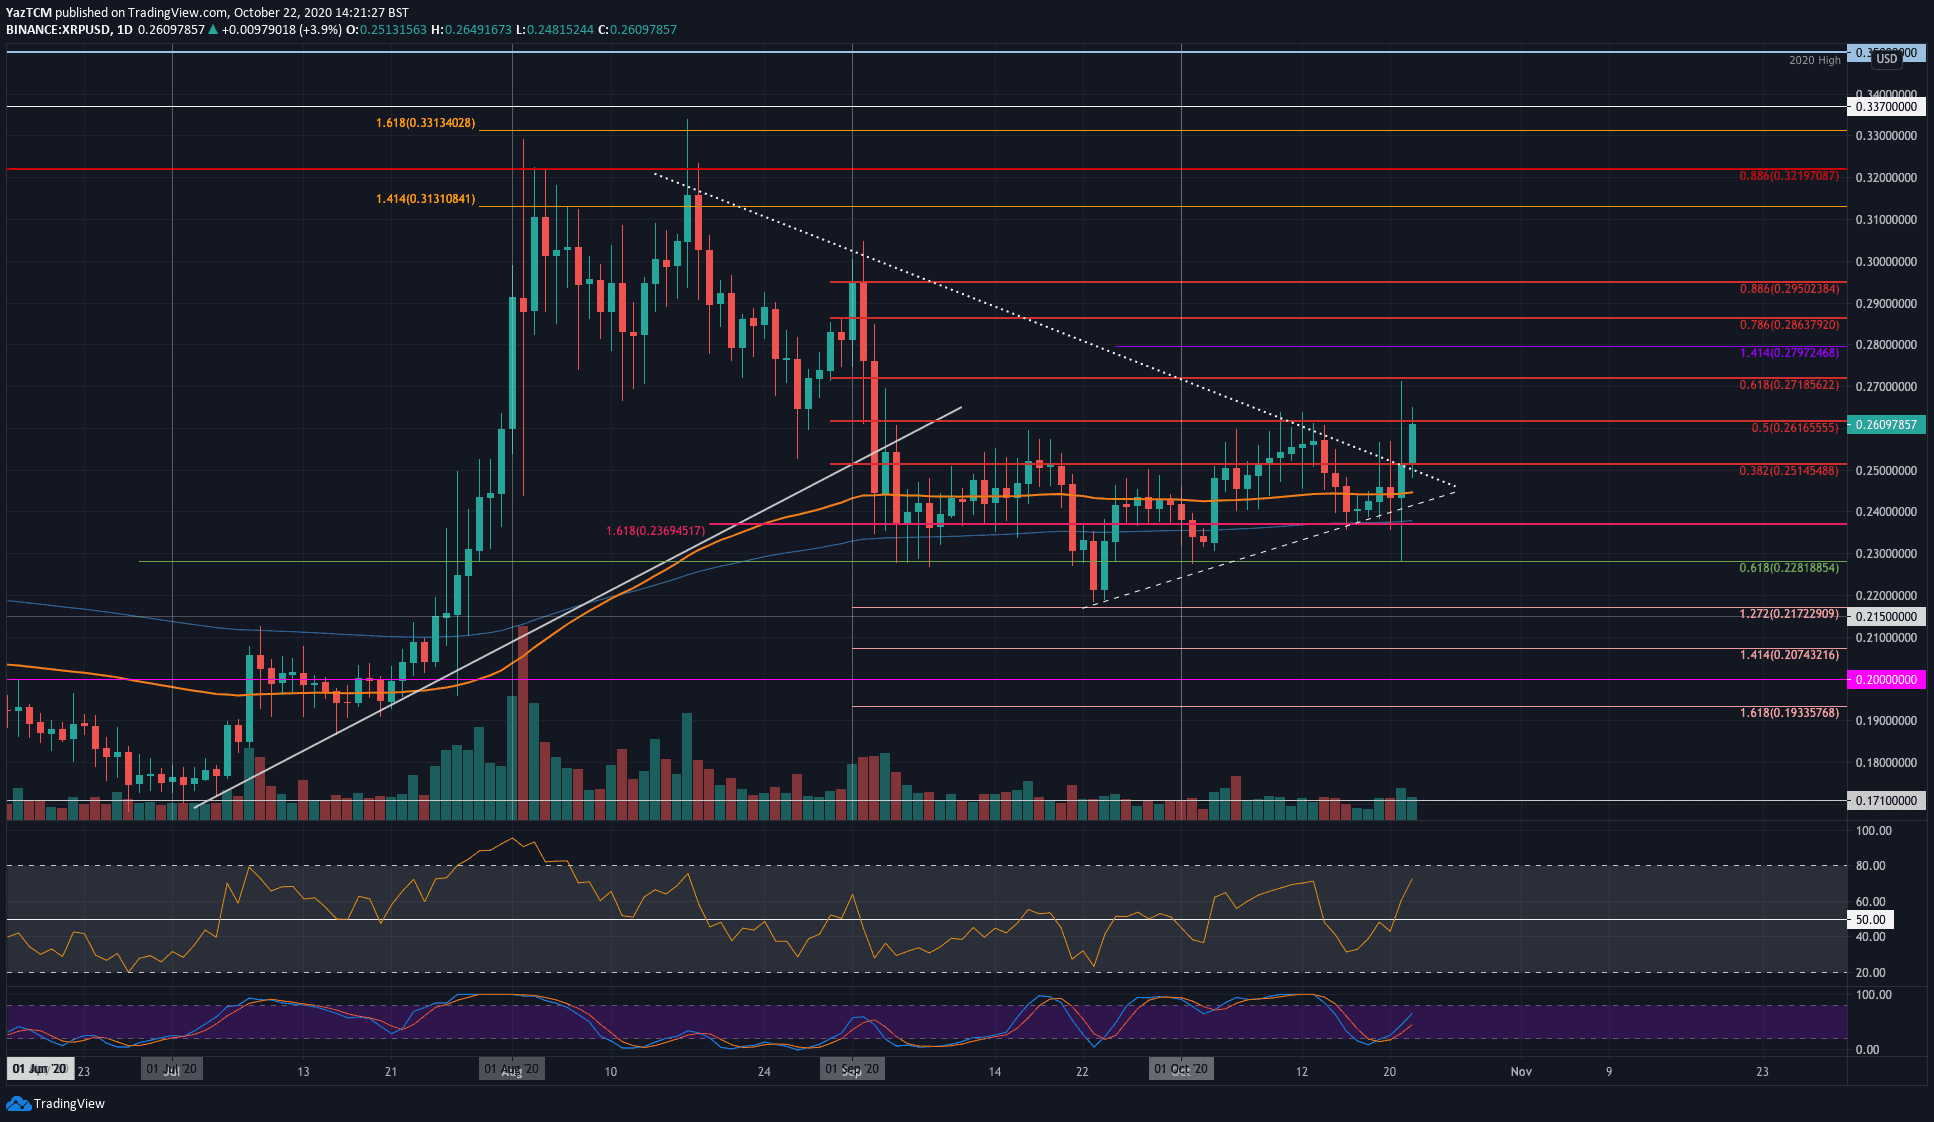
XRP/USD Daily Chart. Source: TradingView
Key Support Levels: $0.26, $0.251, $0.245.
Key Resistance Levels: $0.261, $0.271, $0.279.
XRP went through a rollercoaster of price action yesterday as it reached as high as $0.271 (bearish .618 Fib) and as low as $0.228 (.618 Fib) during the 24 hours.
The cryptocurrency had been trading within a symmetrical triangle and rebounded from the lower boundary at the start of the week. Despite the whipsaw like movement yesterday, the daily candle still closed beneath the triangle’s upper boundary.
Today, XRP pushed higher to break toward the upside of this triangle. It reached the resistance at $0.261, provided by a bearish .5 Fib Retracement level.
Moving forward, if the buyers can break the current $0.261 level, higher resistance lies at $0.271 (bearish .618 Fib Retracement). Following this, resistance lies at $0.279 (1.414 Fib Extension), $0.286 (bearish .786 Fib), $0.295 (bearish .886 Fib), and $0.3.
On the other side, the first level of support lies at $0.26. Beneath this, support is expected at $0.251, $0.245 (100-days EMA), and $0.237 (200-days EMA).
The Stochastic RSI produced a bullish crossover signal, which helped the recent push higher.
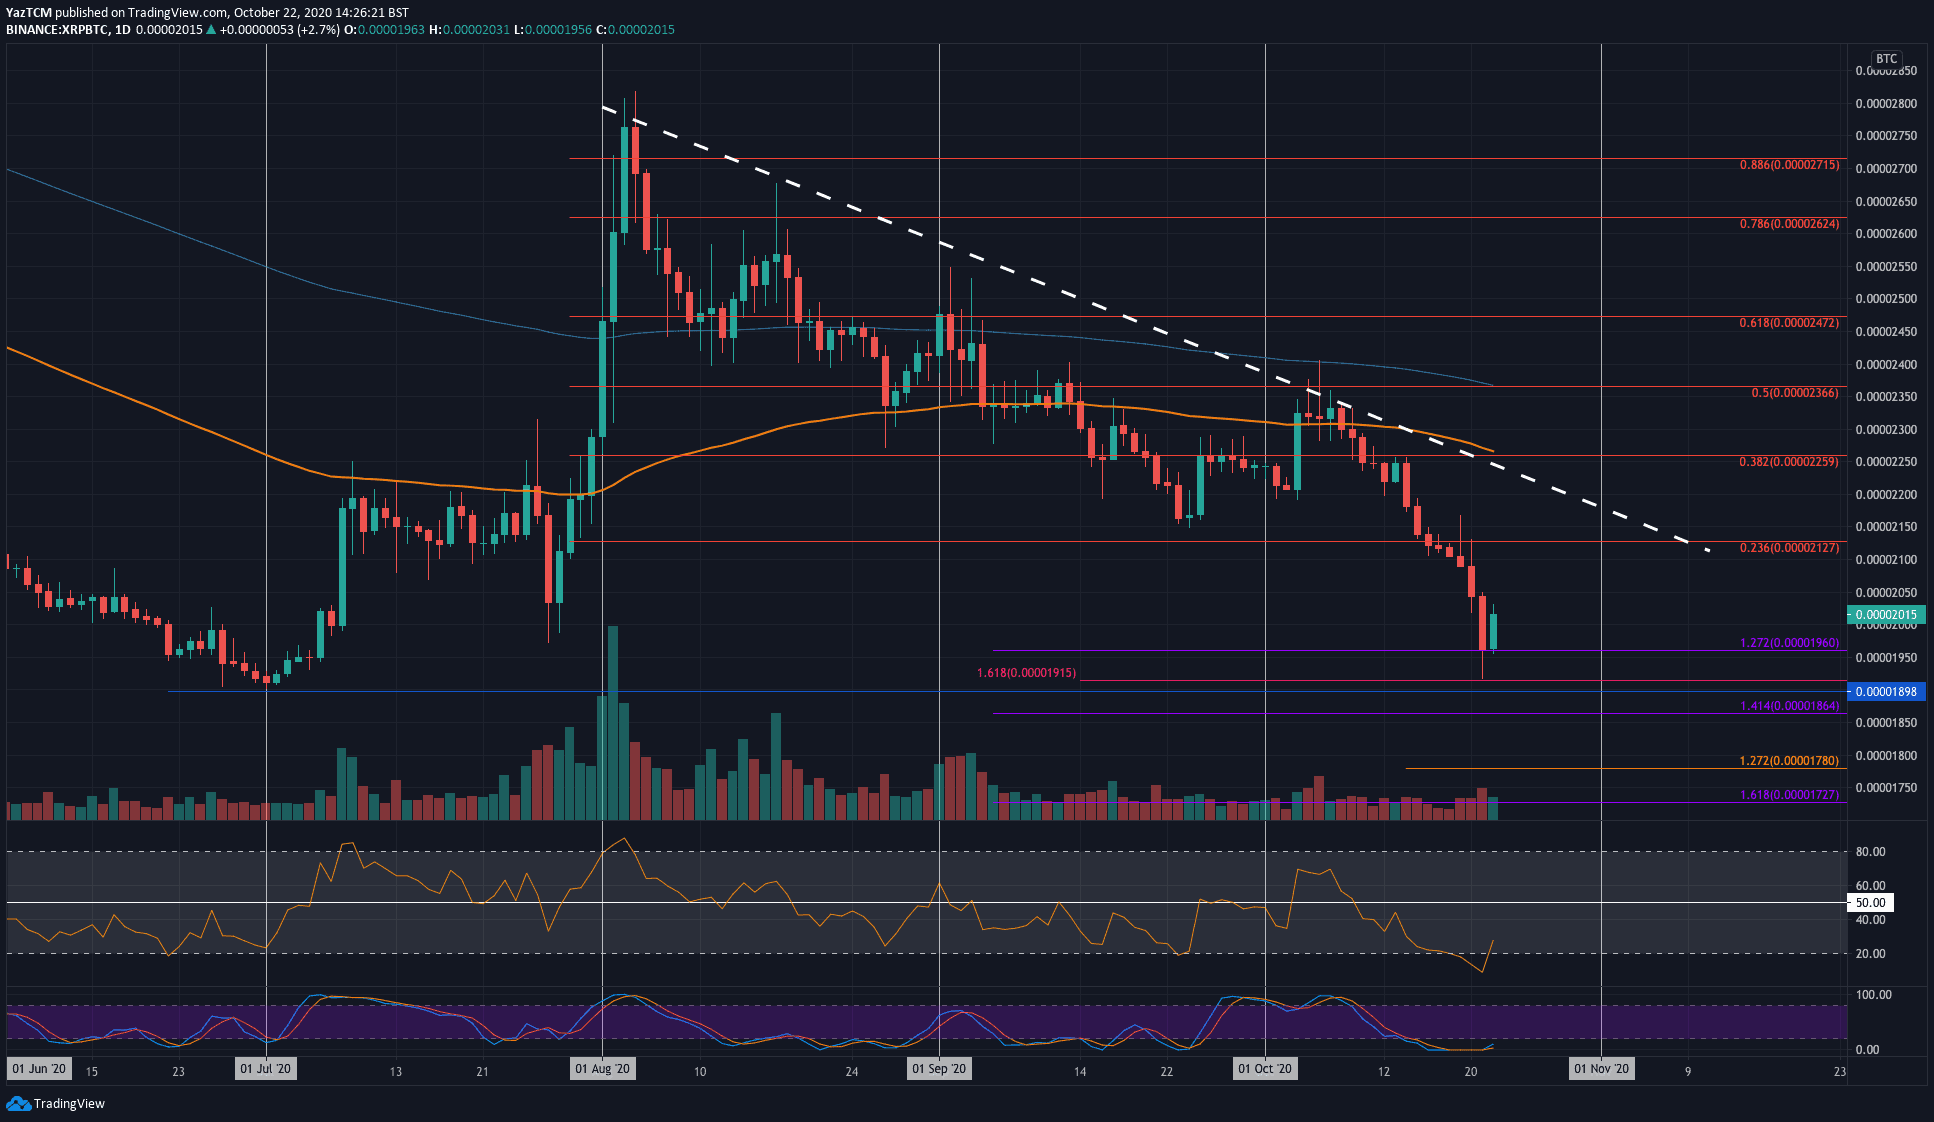
Key Support Levels: 2000 SAT, 1960 SAT, 1915 SAT.
Key Resistance Levels: 2050 SAT, 2127 SAT, 2200 SAT.
XRP has been struggling throughout the entire month of October against Bitcoin. Yesterday, the coin fell from 2050 SAT and broke beneath 2000 SAT. It continued to spike as low as 1915 SAT where it found support at a downside 1.618 Fib Extension.
The coin managed to close the daily candle at the 1960 SAT level (downside 1.272 Fib Extension) and it has rebounded back above 2000 SAT today as it trades at 2015 SAT.
Looking ahead, if the buyers continue higher, the first level of resistance lies 2050 SAT. Above this, resistance lies at 2127 SAT (bearish .236 Fib), 2200 SAT, and 2260 SAT (bearish .372 Fib & 100-days EMA).
On the other side, if the sellers break back beneath 2000 SAT, support lies at 1960 SAT, 1915 SAT, and 1900 SAT.
The Stochastic RSI is in extremely oversold territory as we wait for a bullish crossover signal to send the market higher.