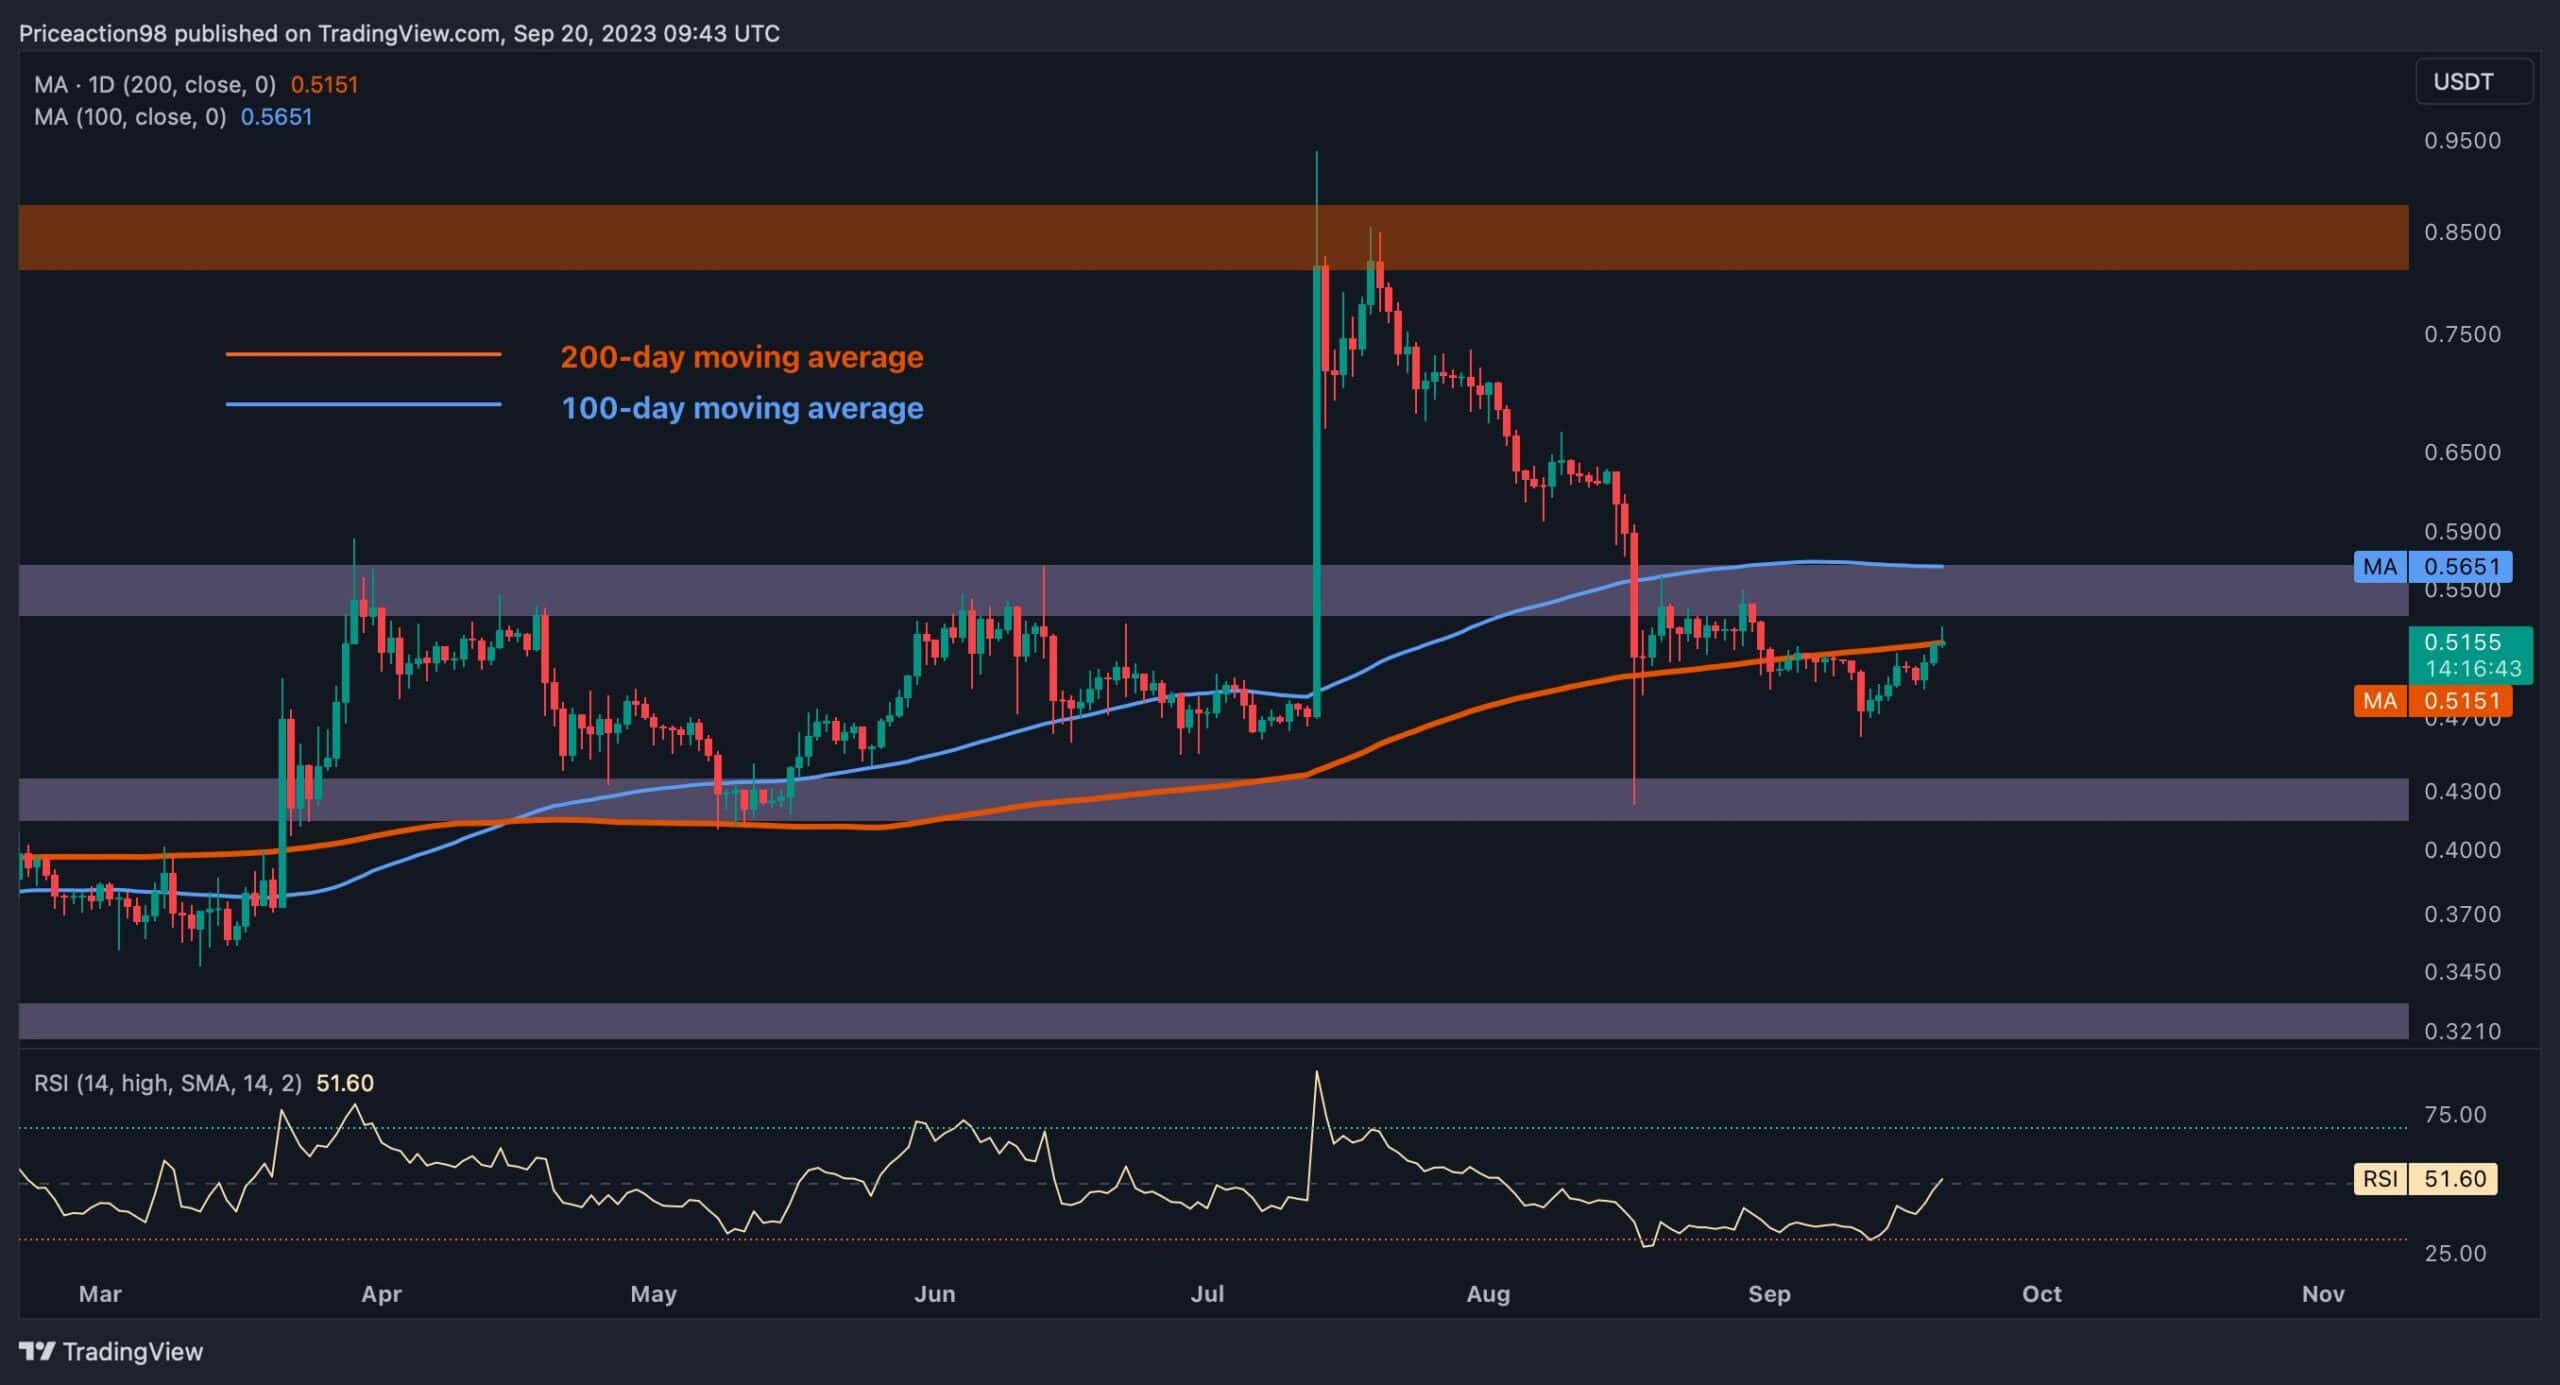
As discussed earlier in our analysis, Ripple recently dropped below its 200-day moving average in late August and continued to decline.
However, it subsequently experienced a rebound, leading to a rally back towards the 200-day MA. This could indicate the formation of a pullback, suggesting a prevailing bearish sentiment in the market.
By Shayan
A closer look at the daily chart shows a strong downtrend, followed by a consolidation phase lasting several weeks. This consolidation occurred after a rapid rebound above the 200-day moving average (MA) in mid-August. During this consolidation period, the price of Ripple displayed low volatility. However, as selling pressure gradually increased, it eventually fell below the 200-day MA, which was at $0.51.
The 200-day MA is generally seen as a key level of support or resistance. The fact that the price dropped below it highlights the prevailing bearish sentiment in the market, with the potential for further downward movement.
Although there has been a modest upward retracement, which could be seen as a pullback to the breached MA, the overall outlook for Ripple remains highly bearish. The next likely target is the critical support zone at $0.42. However, this scenario is only valid if the pullback continues and the price fails to reclaim the 200-day MA.
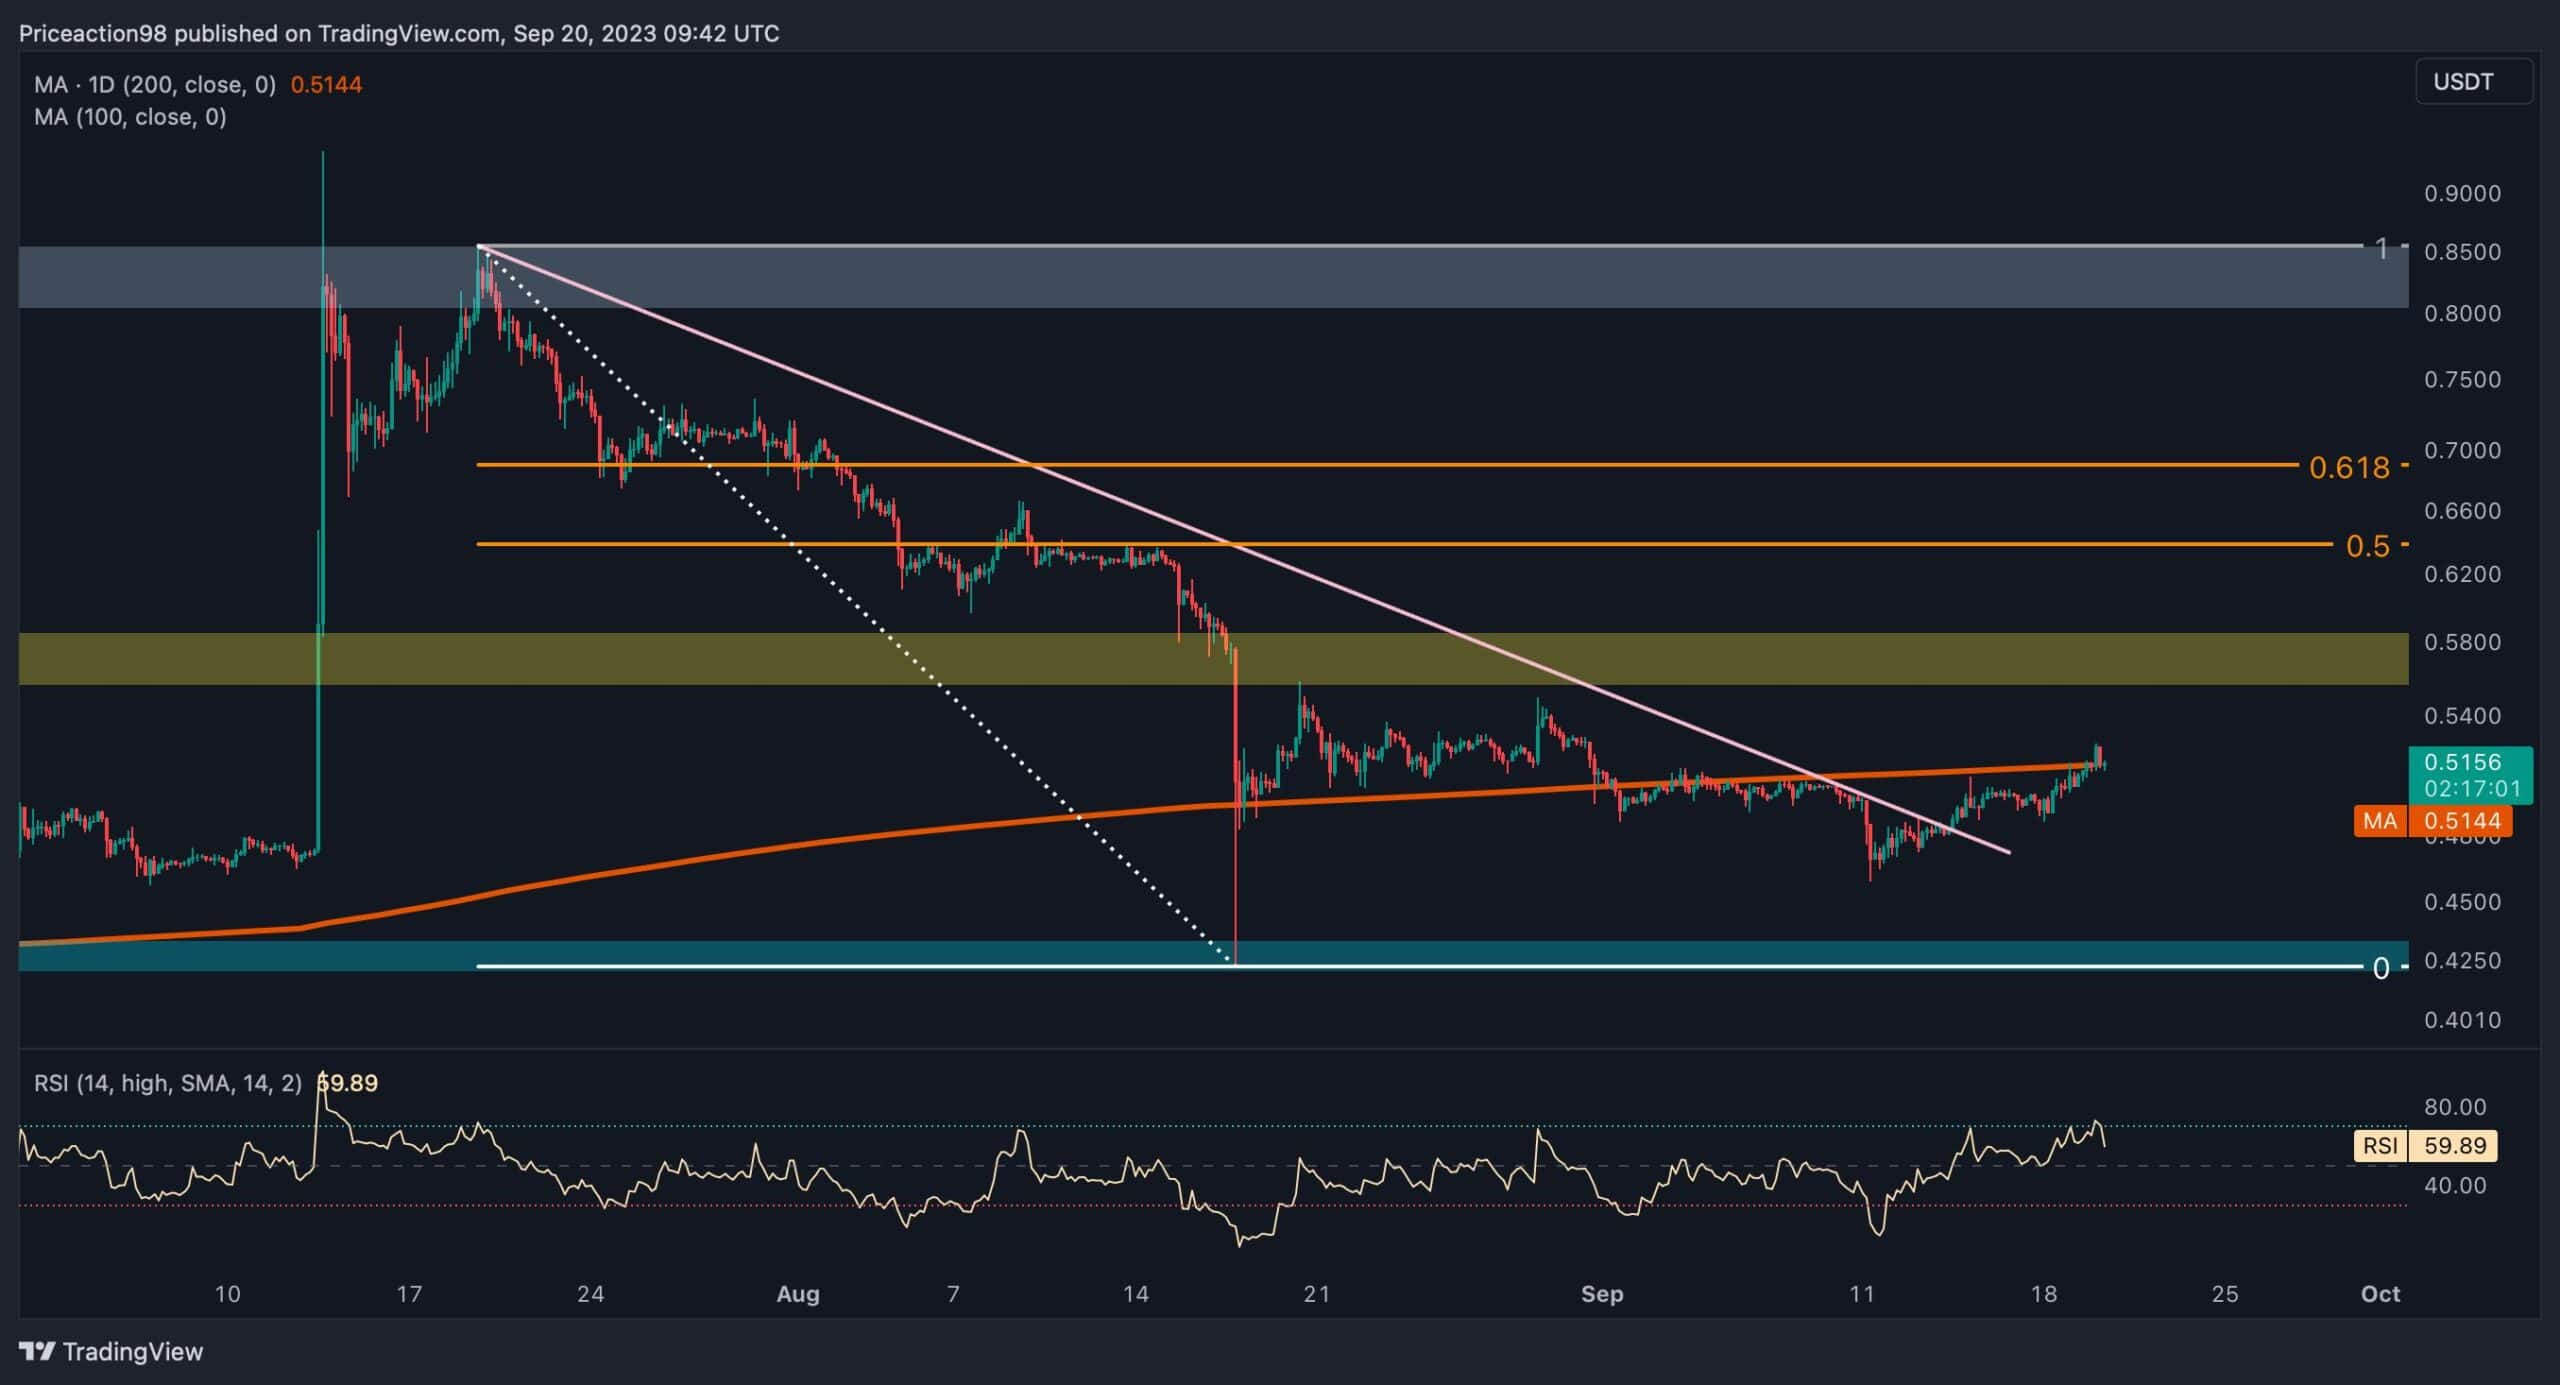
Shifting our attention to the 4-hour chart, we can observe a well-defined multi-month downtrend in Ripple’s price. It’s characterized by consistent lower highs and lower lows, highlighting the strength of the bearish movement.
However, there has been a notable development recently. The price has broken above the downtrend trendline, formed a pullback, and surpassed its previous swing high, creating a new higher high.
This price action has temporarily shifted the market trend and brought the price closer to the 200-day moving average (MA), potentially setting the stage for a pullback toward this moving average.
If the price faces rejection around this crucial price range and starts to decline, the pullback would be considered complete, possibly indicating another bearish movement.
On the other hand, if buyers successfully push the price above this critical threshold and sustain upward momentum, the scenario could shift towards a bullish one. It is important to note that confirmation of this breakout will only be established once the price retraces to retest the breached moving average and forms a pullback. In such a scenario, the price might move towards higher levels, with the potential for a surge towards the static support at $0.55. It is crucial to monitor these price fluctuations diligently as market dynamics evolve.