Stellar Lumens has seen an extraordinary 41% price surge over the past few days, bringing its price to the $0.082 level. This latest increase made XLM the strongest performing cryptocurrency out of the top 50 projects in the last days. Despite the recent spike, XLM still has a long way to recover as it’s still down by a total of 35% over the past 3 months.
XLM is the tenth-largest cryptocurrency with a market cap of $1.66 billion.
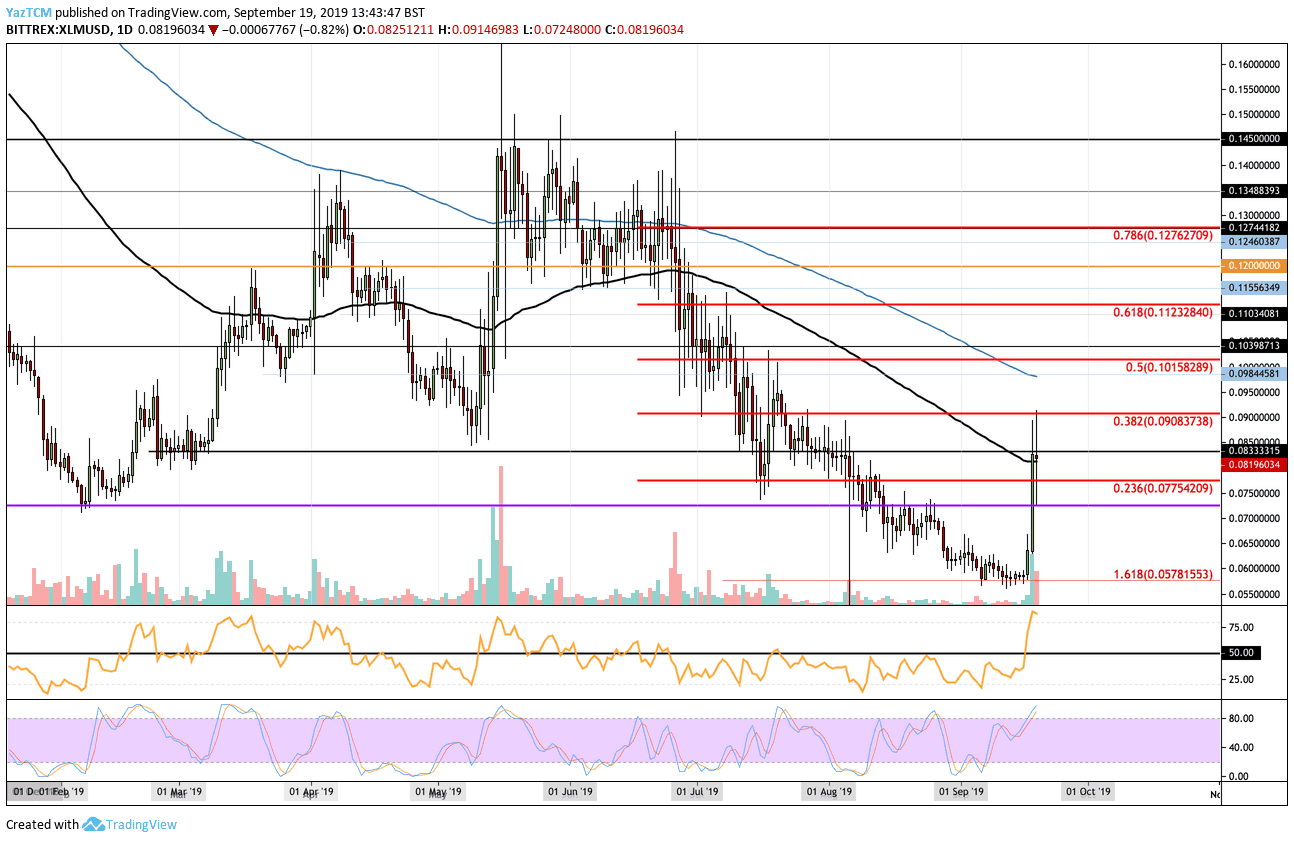
Looking at the XLM/USD 1-Day Chart:
- Since reaching a high of around $0.145 in June, XLM has been struggling heavily. The cryptocurrency dropped by a total of 61% from June’s high to the support seen in September at $0.0578. After reaching this support, XLM rebounded higher to meet resistance at $0.0908 (provided by the bearish .382 Fibonacci Retracement level). XLM is currently testing lower resistance at the 100-days EMA.
- From above: If the bulls continue back above the 100-days EMA the next level of resistance is located at $0.0908. Above this, resistance is found at $0.095 and $0.09844 (bolstered by 200-days EMA). Further resistance is expected at $0.101 (bearish .5 Fib Retracement), $0.104, $0.11, and $0.1123 (bearish .618 Fib Retracement).
- From below: The nearest level of support lies at the 100-days EMA. Beneath this, support lies at $0.08, $0.077, $0.075, $0.072, and $0.070. Beneath $0.07, support is located at $0.065 and $0.060.
- The trading volume has seen a significant surge over the past few days but is starting to fall again.
- Unsurprisingly, the RSI is in extreme overbought conditions which shows the bulls may need a break before climbing higher (which is actually happening right now).
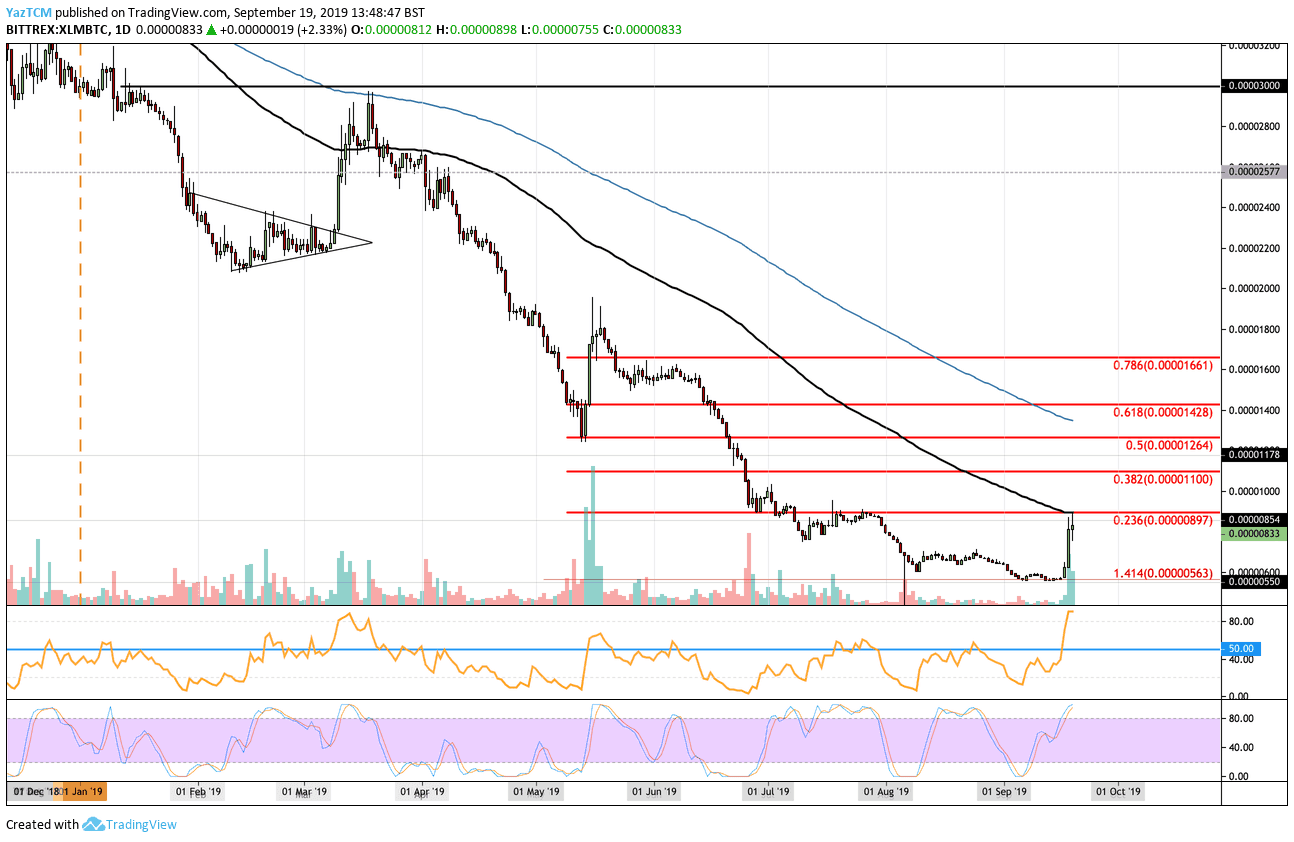
Looking at the XLM/BTC 1-Day Chart:
- Against Bitcoin, Stellar has struggled heavily after dropping by a precipitous 82% from the 2019 opening price to its low at 563 SAT. The support at 563 SAT has allowed XLM to rebound into resistance provided by the 100-days EMA at 900 SAT. This resistance is strengthened by the bearish .236 Fib Retracement.
- From above: If the bulls break above the 100-days EMA, resistance is located at 1000 SAT. Above this, resistance is expected at 1100 SAT (bearish .382 Fib REtracement), 1178 SAT, 1264 SAT (bearish .5 Fib Retracement), and 1350 SAT (200-days EMA).
- From below: The nearest level of support is located at 800 SAT. Beneath this, support can be found at 750 SAT, 700 SAT, 650 SAT, and 600 SAT.
- The trading volume has seen a large increase over the past few days.
- Likewise, the RSI is extremely overbought which suggests that the buyers may be a little overextended. This should warn us to be cautious of a small retracement before climbing higher.
SPECIAL OFFER (Sponsored)
Binance Free $600 (CryptoPotato Exclusive): Use this link to register new account and receive $600 exclusive welcome offer on Binance (
full details).
LIMITED OFFER 2024 for CryptoPotato readers at Bybit: Use this link to register and open a $500 BTC-USDT position on Bybit Exchange for free!
Disclaimer: Information found on CryptoPotato is those of writers quoted. It does not represent the opinions of CryptoPotato on whether to buy, sell, or hold any investments. You are advised to conduct your own research before making any investment decisions. Use provided information at your own risk. See Disclaimer for more information.
Cryptocurrency charts by TradingView.