By: Edris
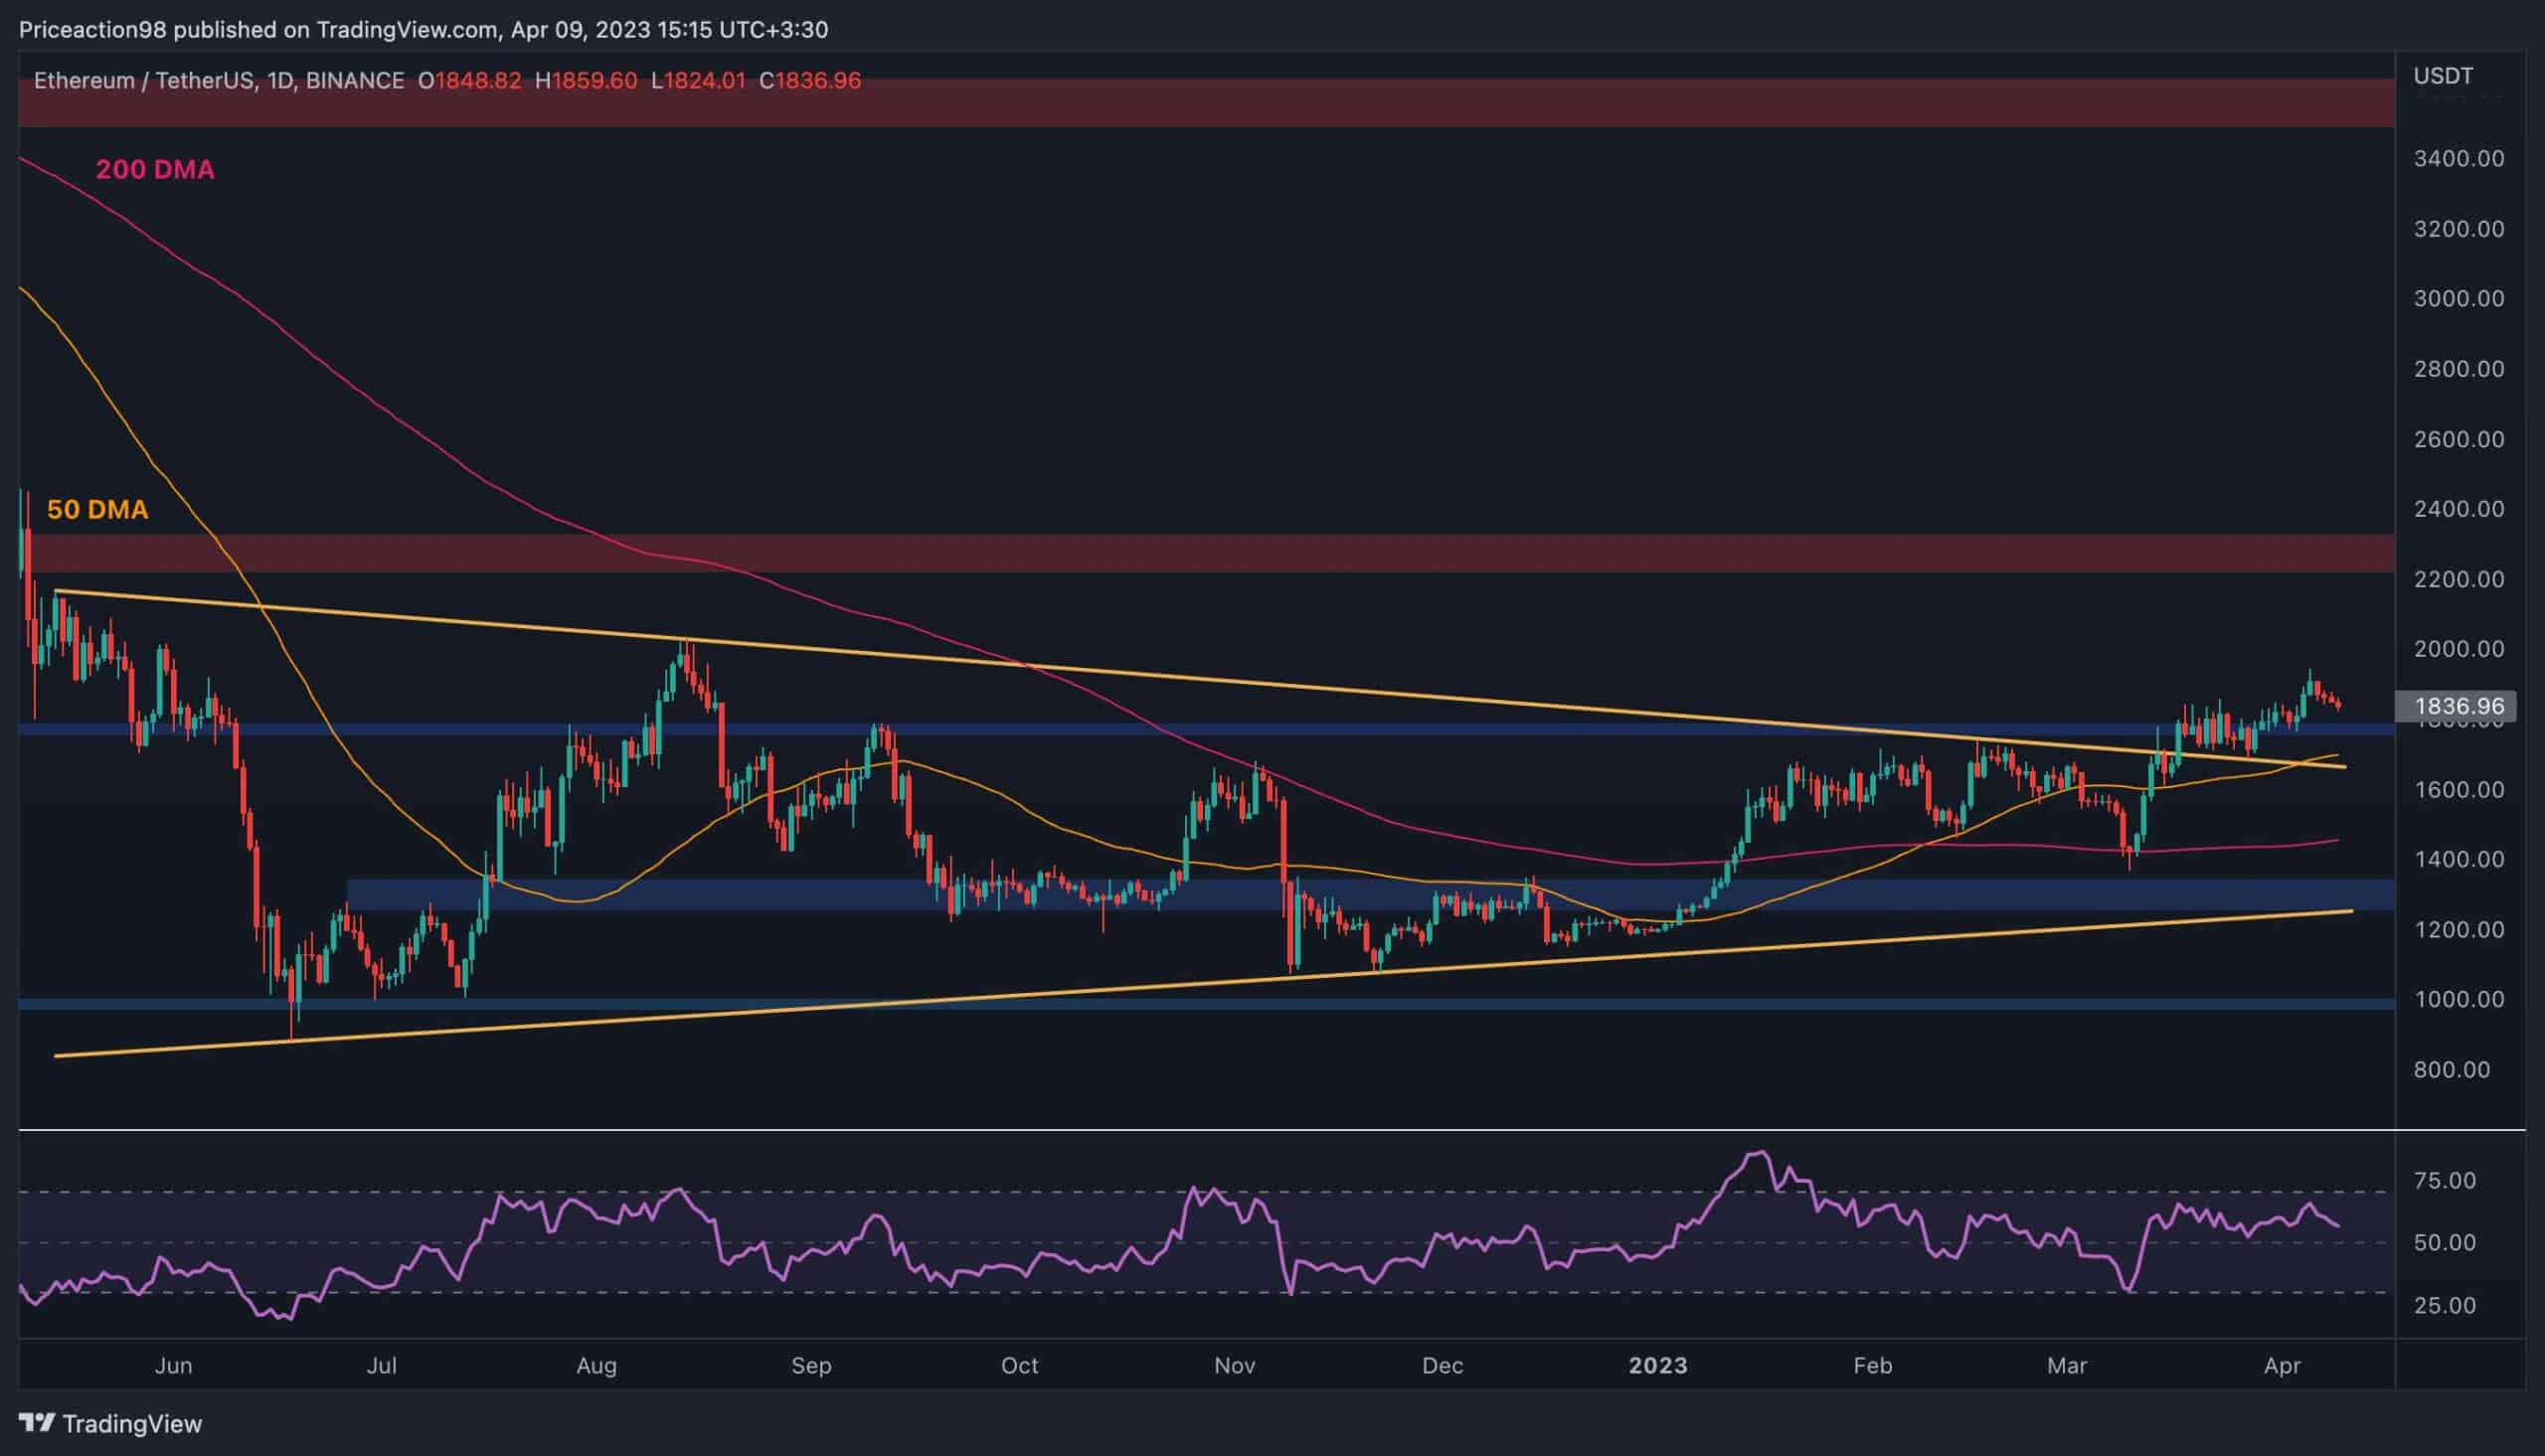
Ethereum’s price has been rallying over the past few months, breaking through multiple significant resistance levels. However, the bullish momentum is seemingly fading as the cryptocurrency is struggling to rise at the time of this writing.
On the daily timeframe, the price has been consolidating above the higher boundary of the large symmetrical triangle pattern and the broken $1800 resistance level.
However, it is unable to surge toward the key $2300 resistance area. A bearish pullback could occur in the short term, and in this case, the $1800 level and the 50-day moving average located around the $1700 mark could provide support.
Furthermore, the RSI indicator shows values above 50%, meaning the bulls are still in control. However, the indicator has been declining lately as the positive momentum is fading.
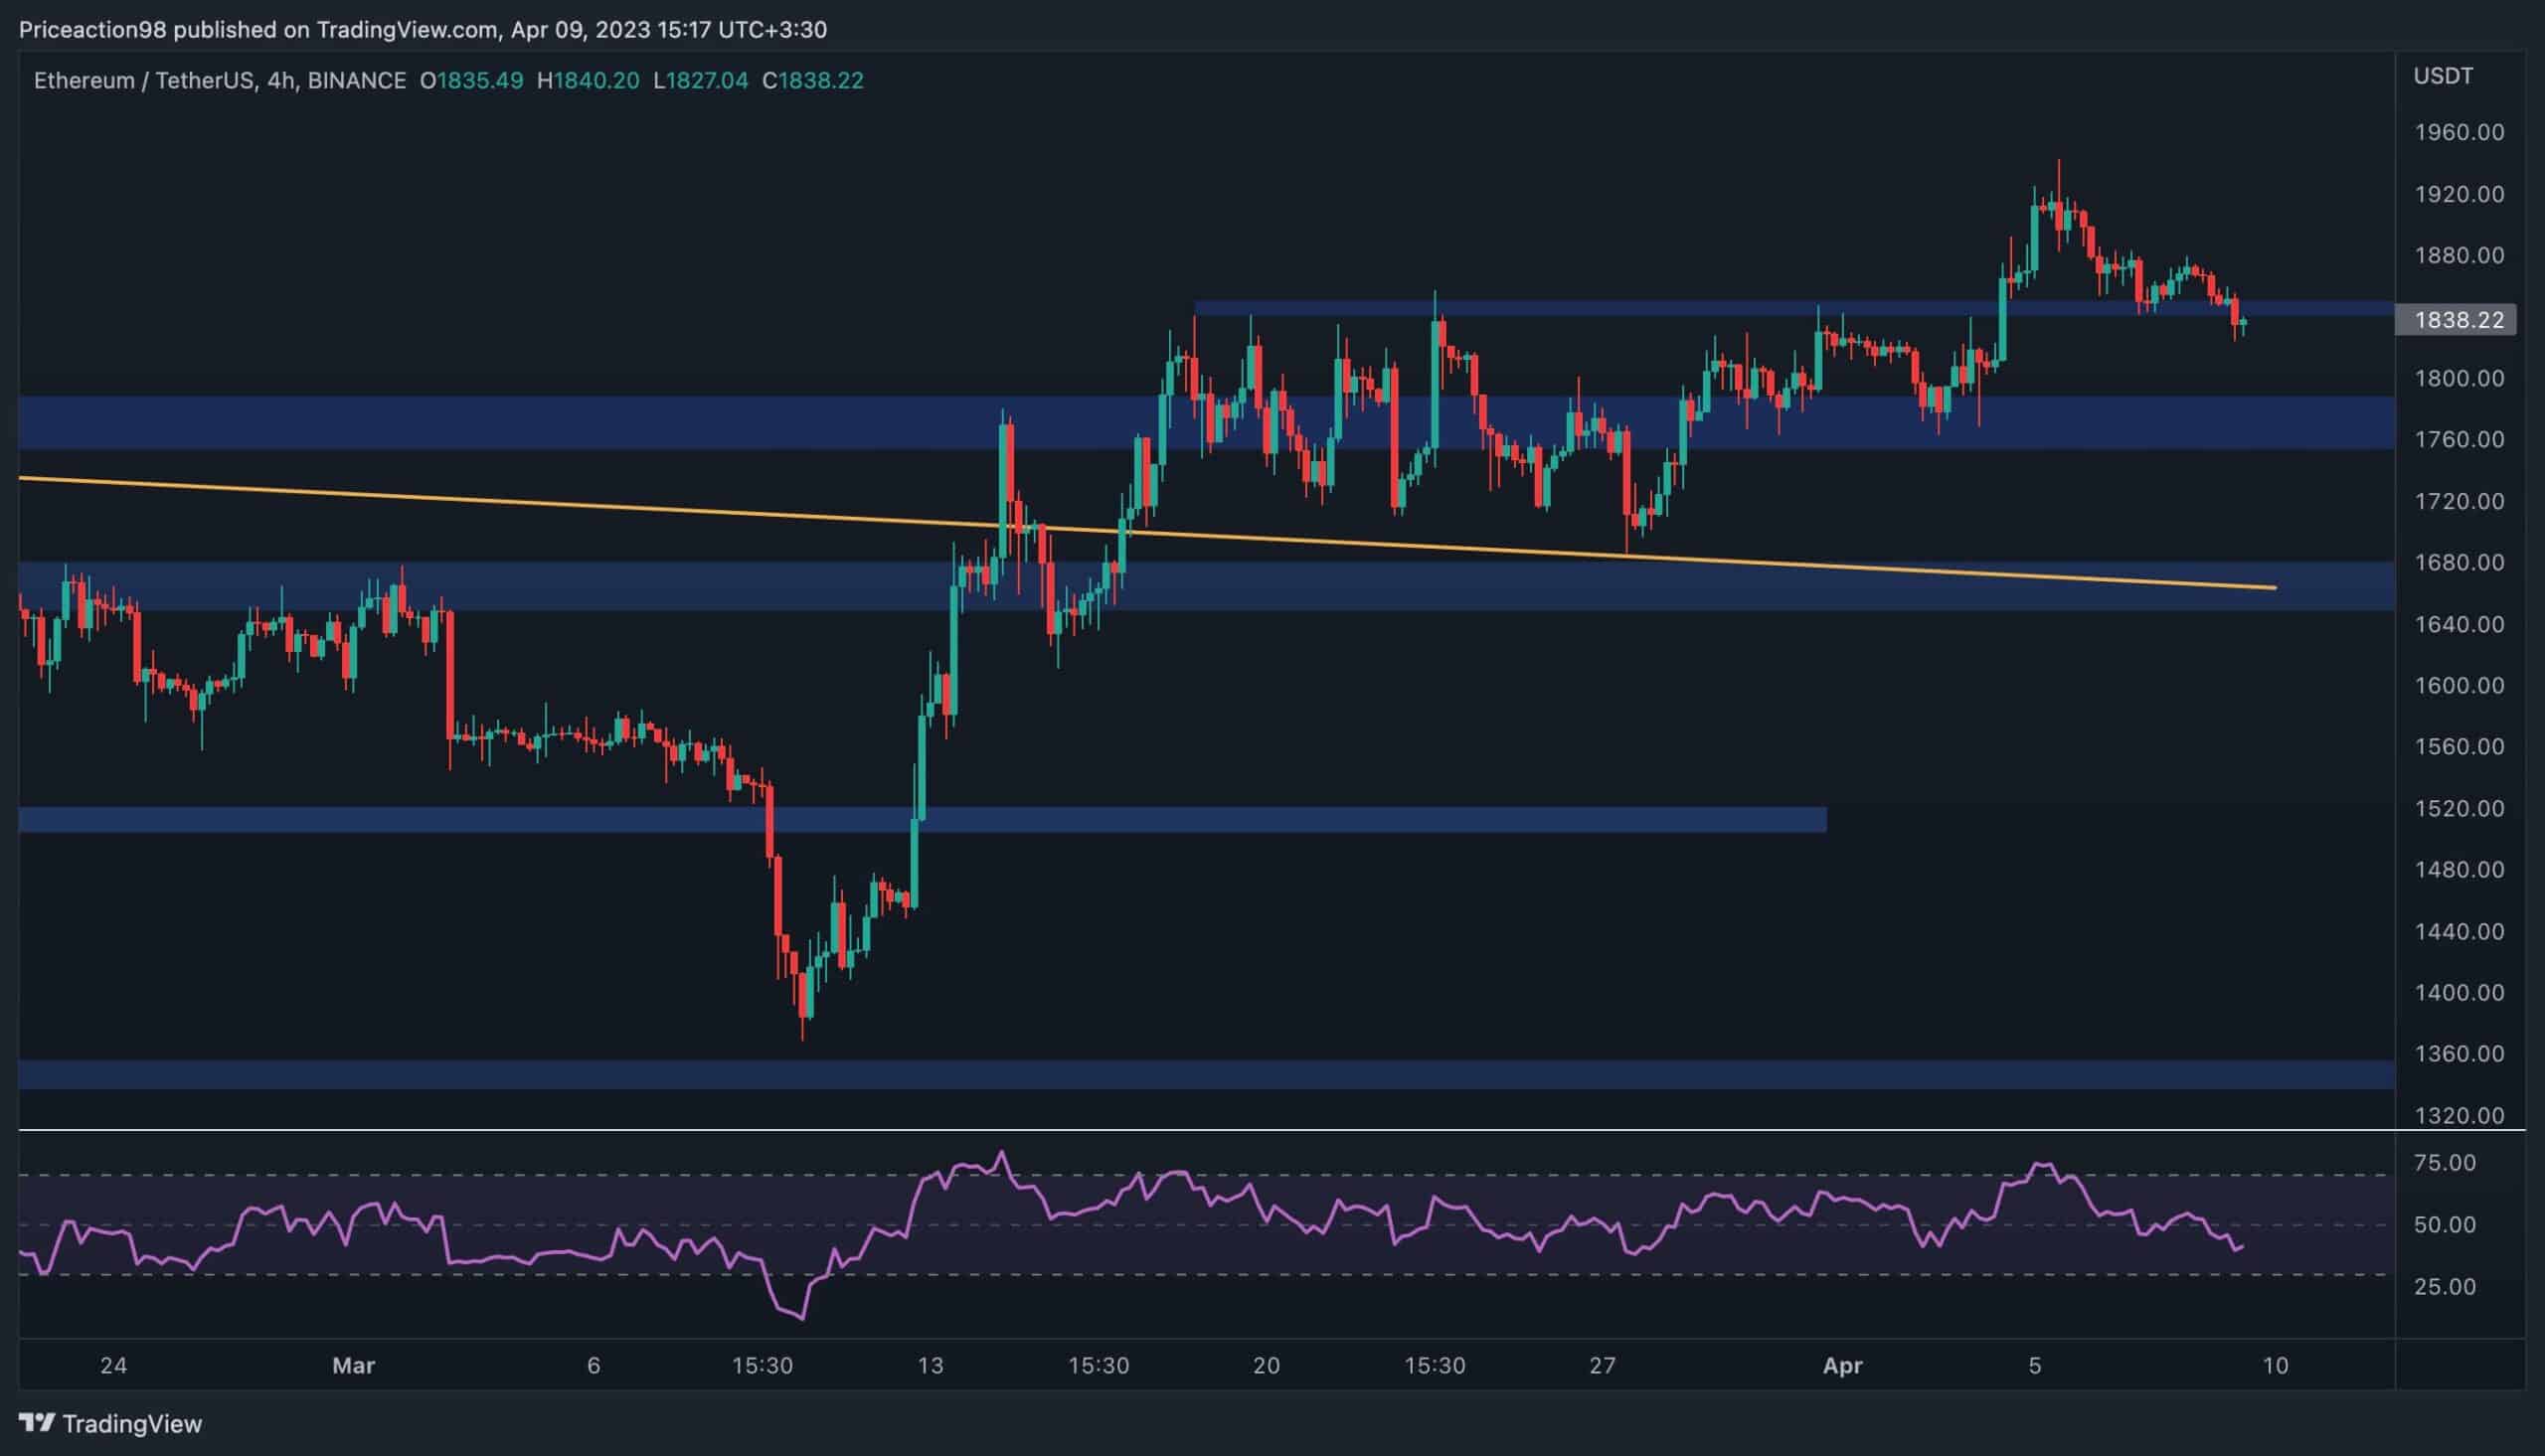
Looking at the 4-hour timeframe, the price has broken out of the tight consolidation range between the $1700 and $1800 levels. The market is currently pulling back towards the $1850 level, following a break back below the $1850 short-term support.
The RSI has also broken below the 50% threshold, boosting the probability of a deeper decline. Yet, the price is demonstrating a correction pattern, and the market could find support around the $1800 area and continue its surge toward the $2000 psychological resistance level in the coming weeks. For this scenario to play out, the market should break back above the $1850 level.
By: Edris
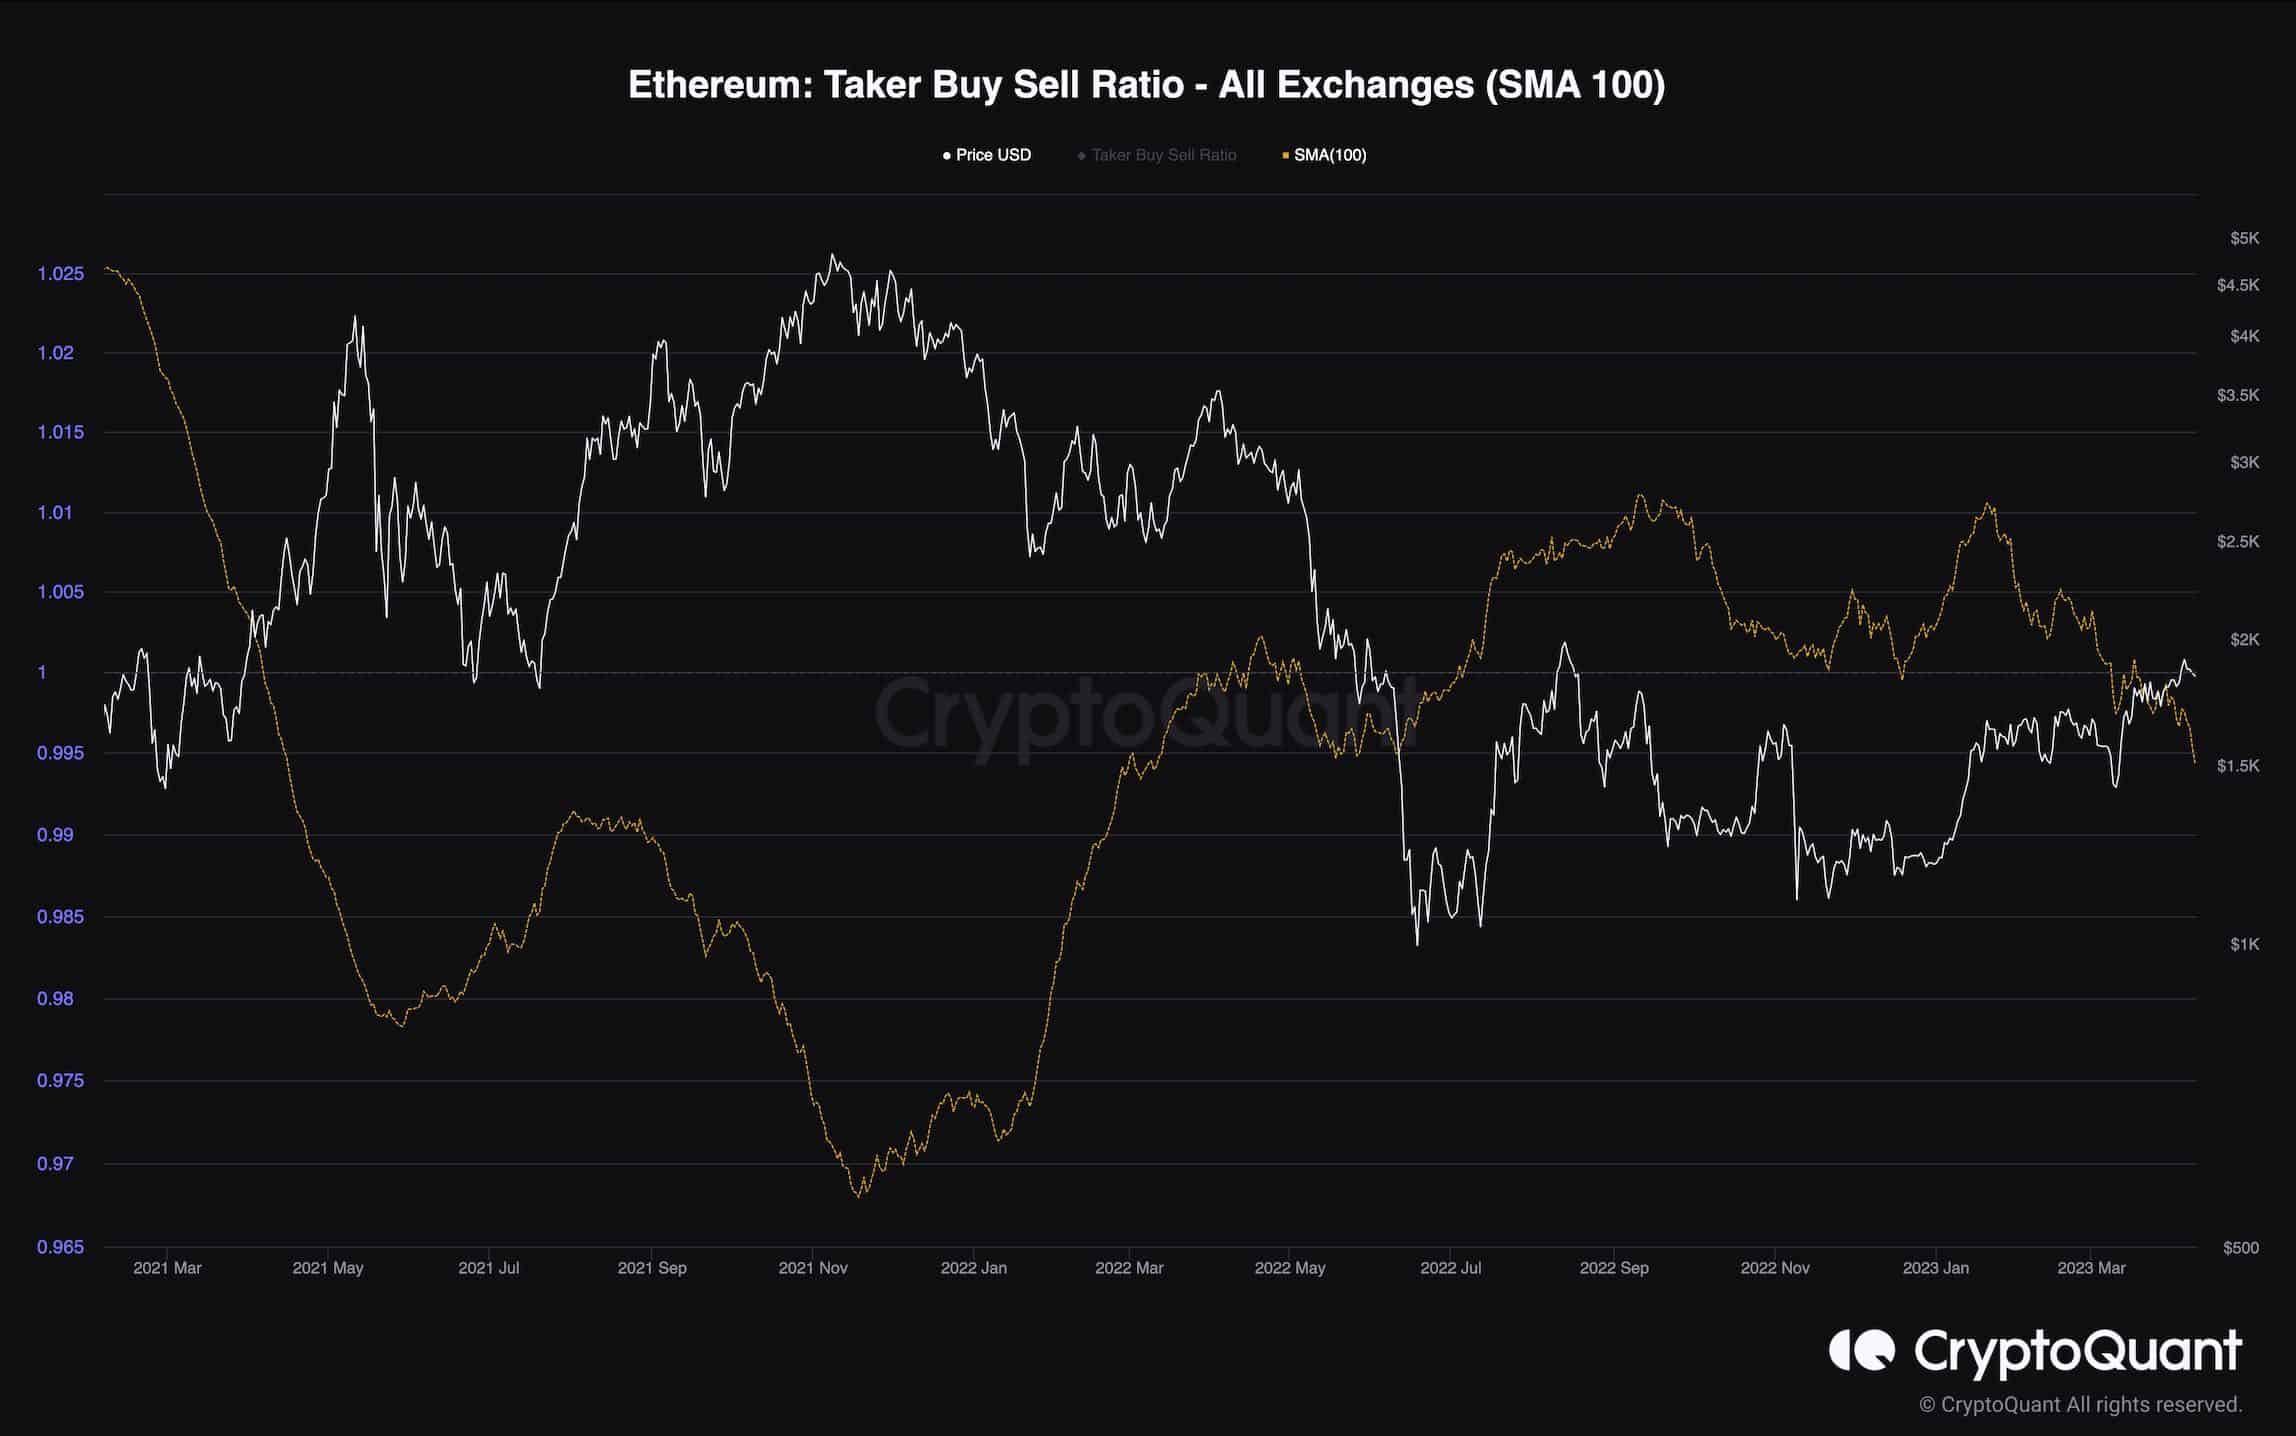
Ethereum’s price has been rallying over the past few months and is approaching the $2,000 level. While many investors are optimistic that the bear market is finally over, the futures market demonstrates a worrying signal.
This chart displays the Taker Buy Sell ratio for ETH, a valuable metric for evaluating futures market sentiment. It determines whether the bulls or the bears are executing their orders more aggressively. Positive values are considered bullish, while negative values are interpreted as bearish in the short term.
Recently, this metric has been on a constant decline and has dropped below zero. This indicates that a pullback or even a reversal could be expected in the coming weeks. Therefore, the Taker Buy Sell ratio metric should be monitored closely, as it provides beneficial insights for the short-term.