Ethereum’s recent surge in momentum encountered a significant obstacle upon reaching a pivotal resistance area, encompassing the upper boundary of a multi-month wedge and the static resistance at $2.4K.
Despite this, the emergence of a head and shoulders pattern suggests an impending retracement towards the $2K support zone.
By Shayan
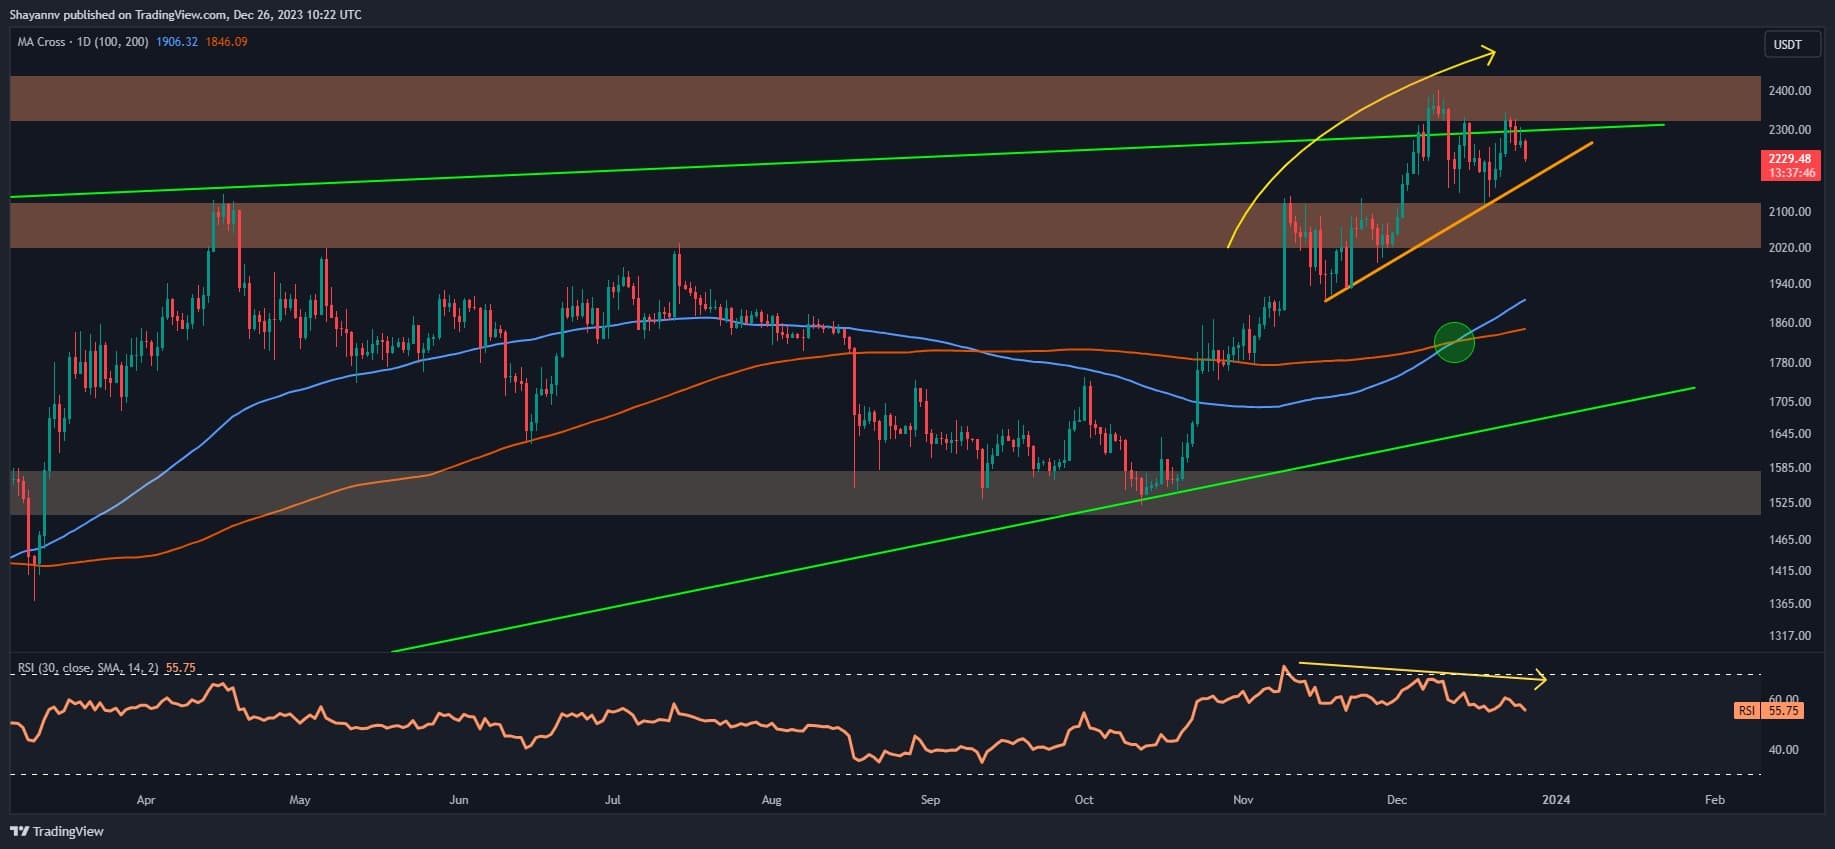
Ethereum witnessed a robust uptrend, achieving an annual peak of $2.4K, underscoring the prevailing influence of buyers in the market. This upward trajectory is further emphasized by a golden cross on the daily chart, signaling an overall bullish sentiment for Ethereum.
However, the ascent was impeded upon encountering a critical resistance zone formed by the upper boundary of the multi-month wedge coinciding with the crucial static support at $2.4K. The resultant heightened selling pressure put a halt to the existing bullish momentum.
Despite these challenges, a potential head and shoulders pattern, a widely recognized bearish reversal formation, has taken shape. The price is teetering on the brink of breaking below the pattern’s neckline, represented by the orange line. Additionally, an extended bearish divergence between the price and the RSI indicator suggests the potential for downward movement in the coming days.
Considering recent price developments, a breach below the neckline of the pattern could pave the way for a short-term downward movement. The anticipated retracement would likely lead the price back toward the substantial support range at $2K.
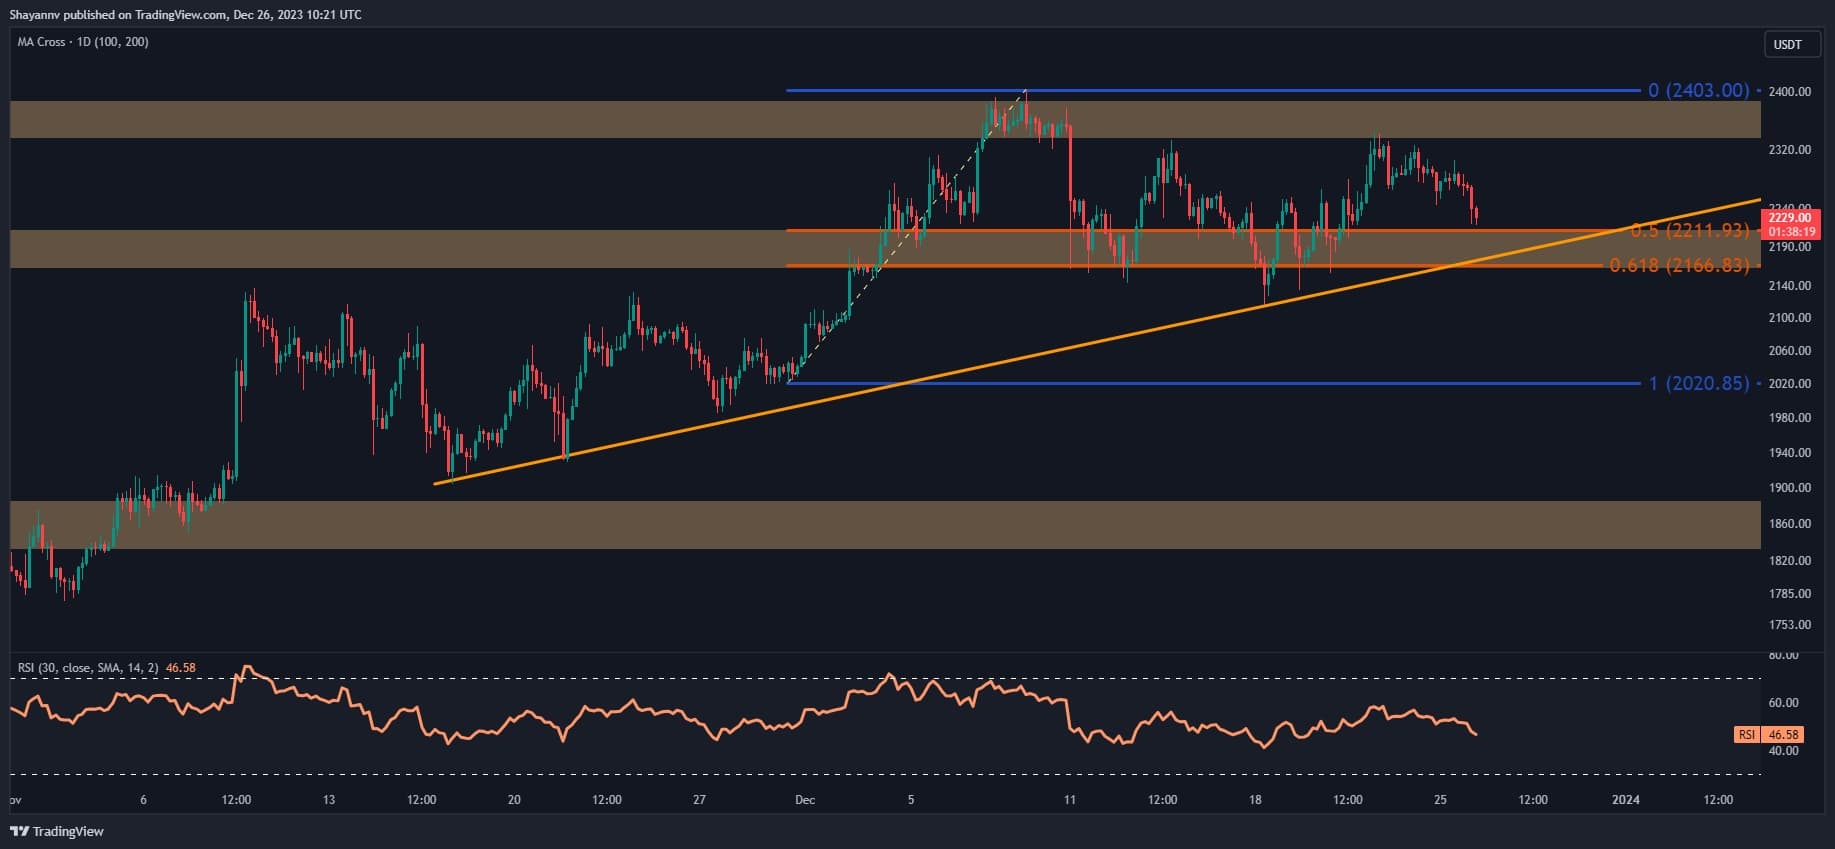
A closer inspection of the 4-hour chart reveals that amid recent sideways movement, the price found robust support within the critical range between the 0.5 ($2,211) and 0.618 ($2,166) levels of the Fibonacci retracement indicator. It acted as a barrier, preventing further downward attempts.
Notably, this essential support range aligns with a dynamic, supportive trendline, adding additional strength against Ethereum sellers. Nevertheless, a scenario in which sellers gain control and push the price below these crucial support levels could trigger a notable cascade, prompting a retracement towards the $2K support region.
By Shayan
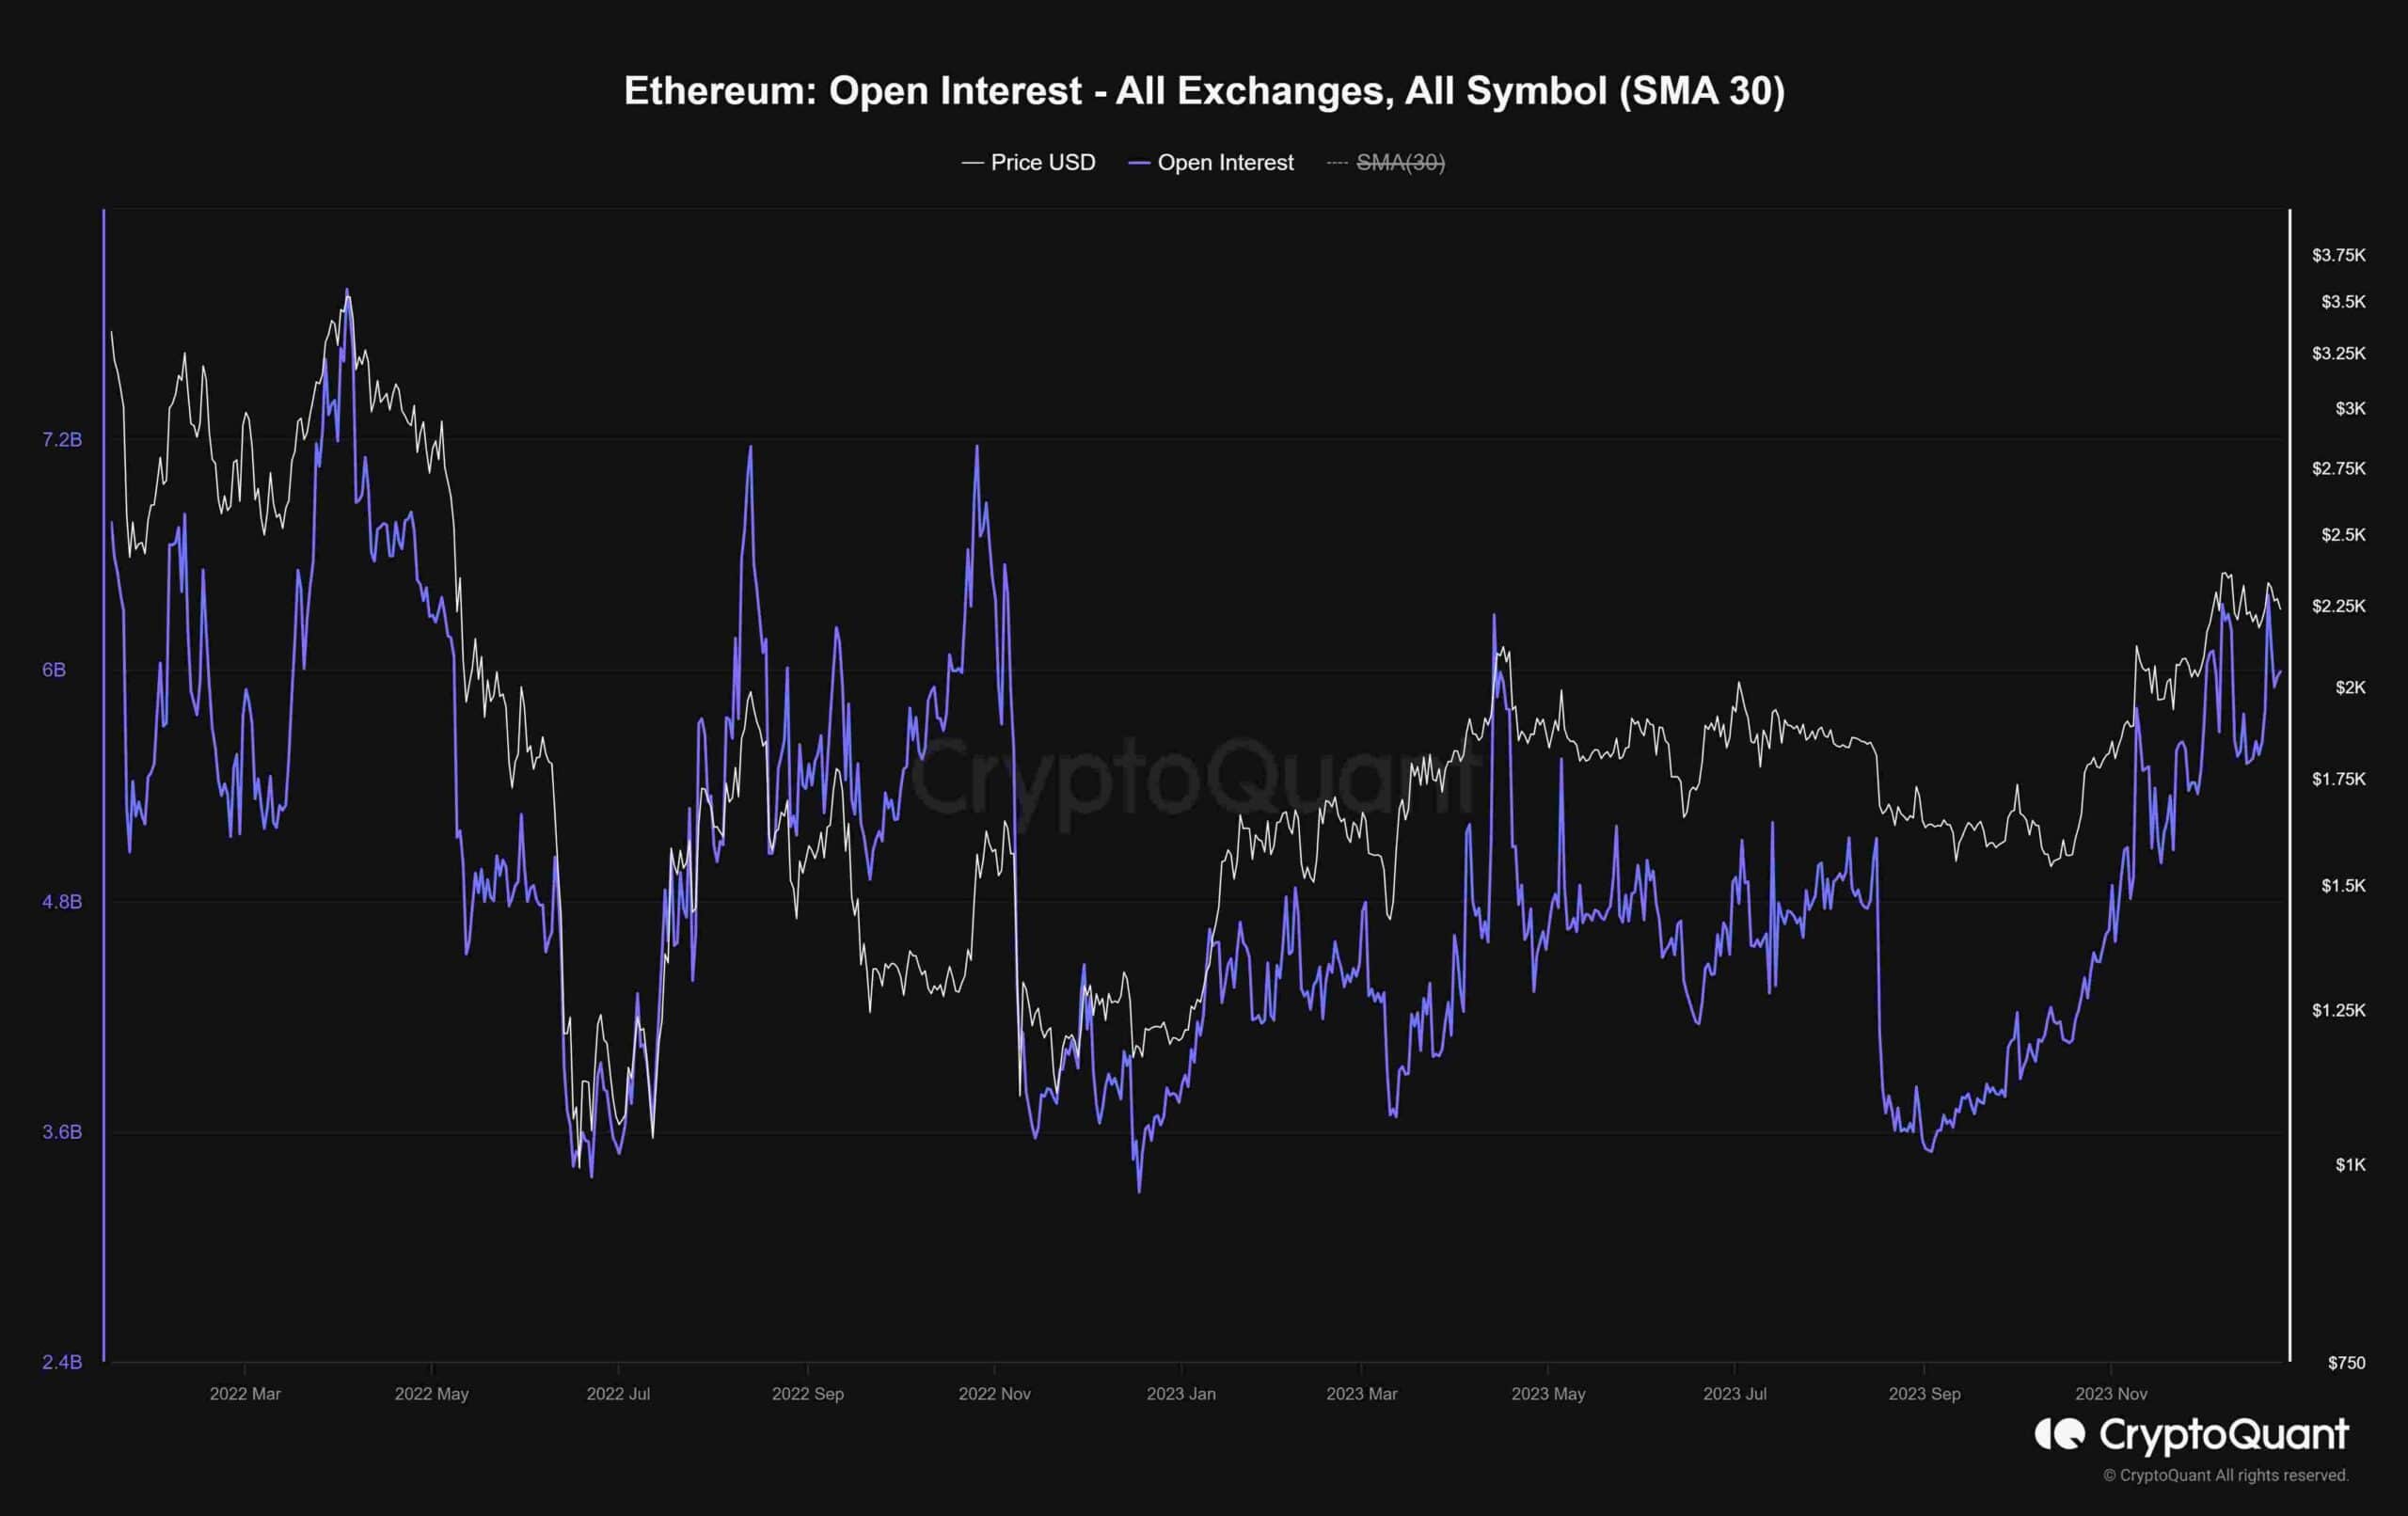
In the realm of on-chain data analysis, delving into the sentiment reflected in the futures market provides valuable insights into Ethereum’s overall outlook. The accompanying chart depicts Ethereum’s open interest metric. Traditionally, heightened values signify increased volatility and the potential for market reversals, whereas lower values indicate a more sustainable trend.
The chart underscores that bullish market movements often coincide with a gradual uptick in the Open Interest metric. However, reaching elevated levels or experiencing steep surges could signal the potential for a significant market reversal, often attributed to long/short squeeze events.
The open interest has been trending upward, albeit not yet reaching the values witnessed during the market’s significant highs. Consequently, while corrections remain a plausible scenario, the futures market is yet to reach a point of overheating. The ongoing bullish trend is likely to endure in the long term, given the moderate levels of open interest. It becomes imperative to closely monitor this metric to discern any potential shifts in market sentiment.