XRP/USD:
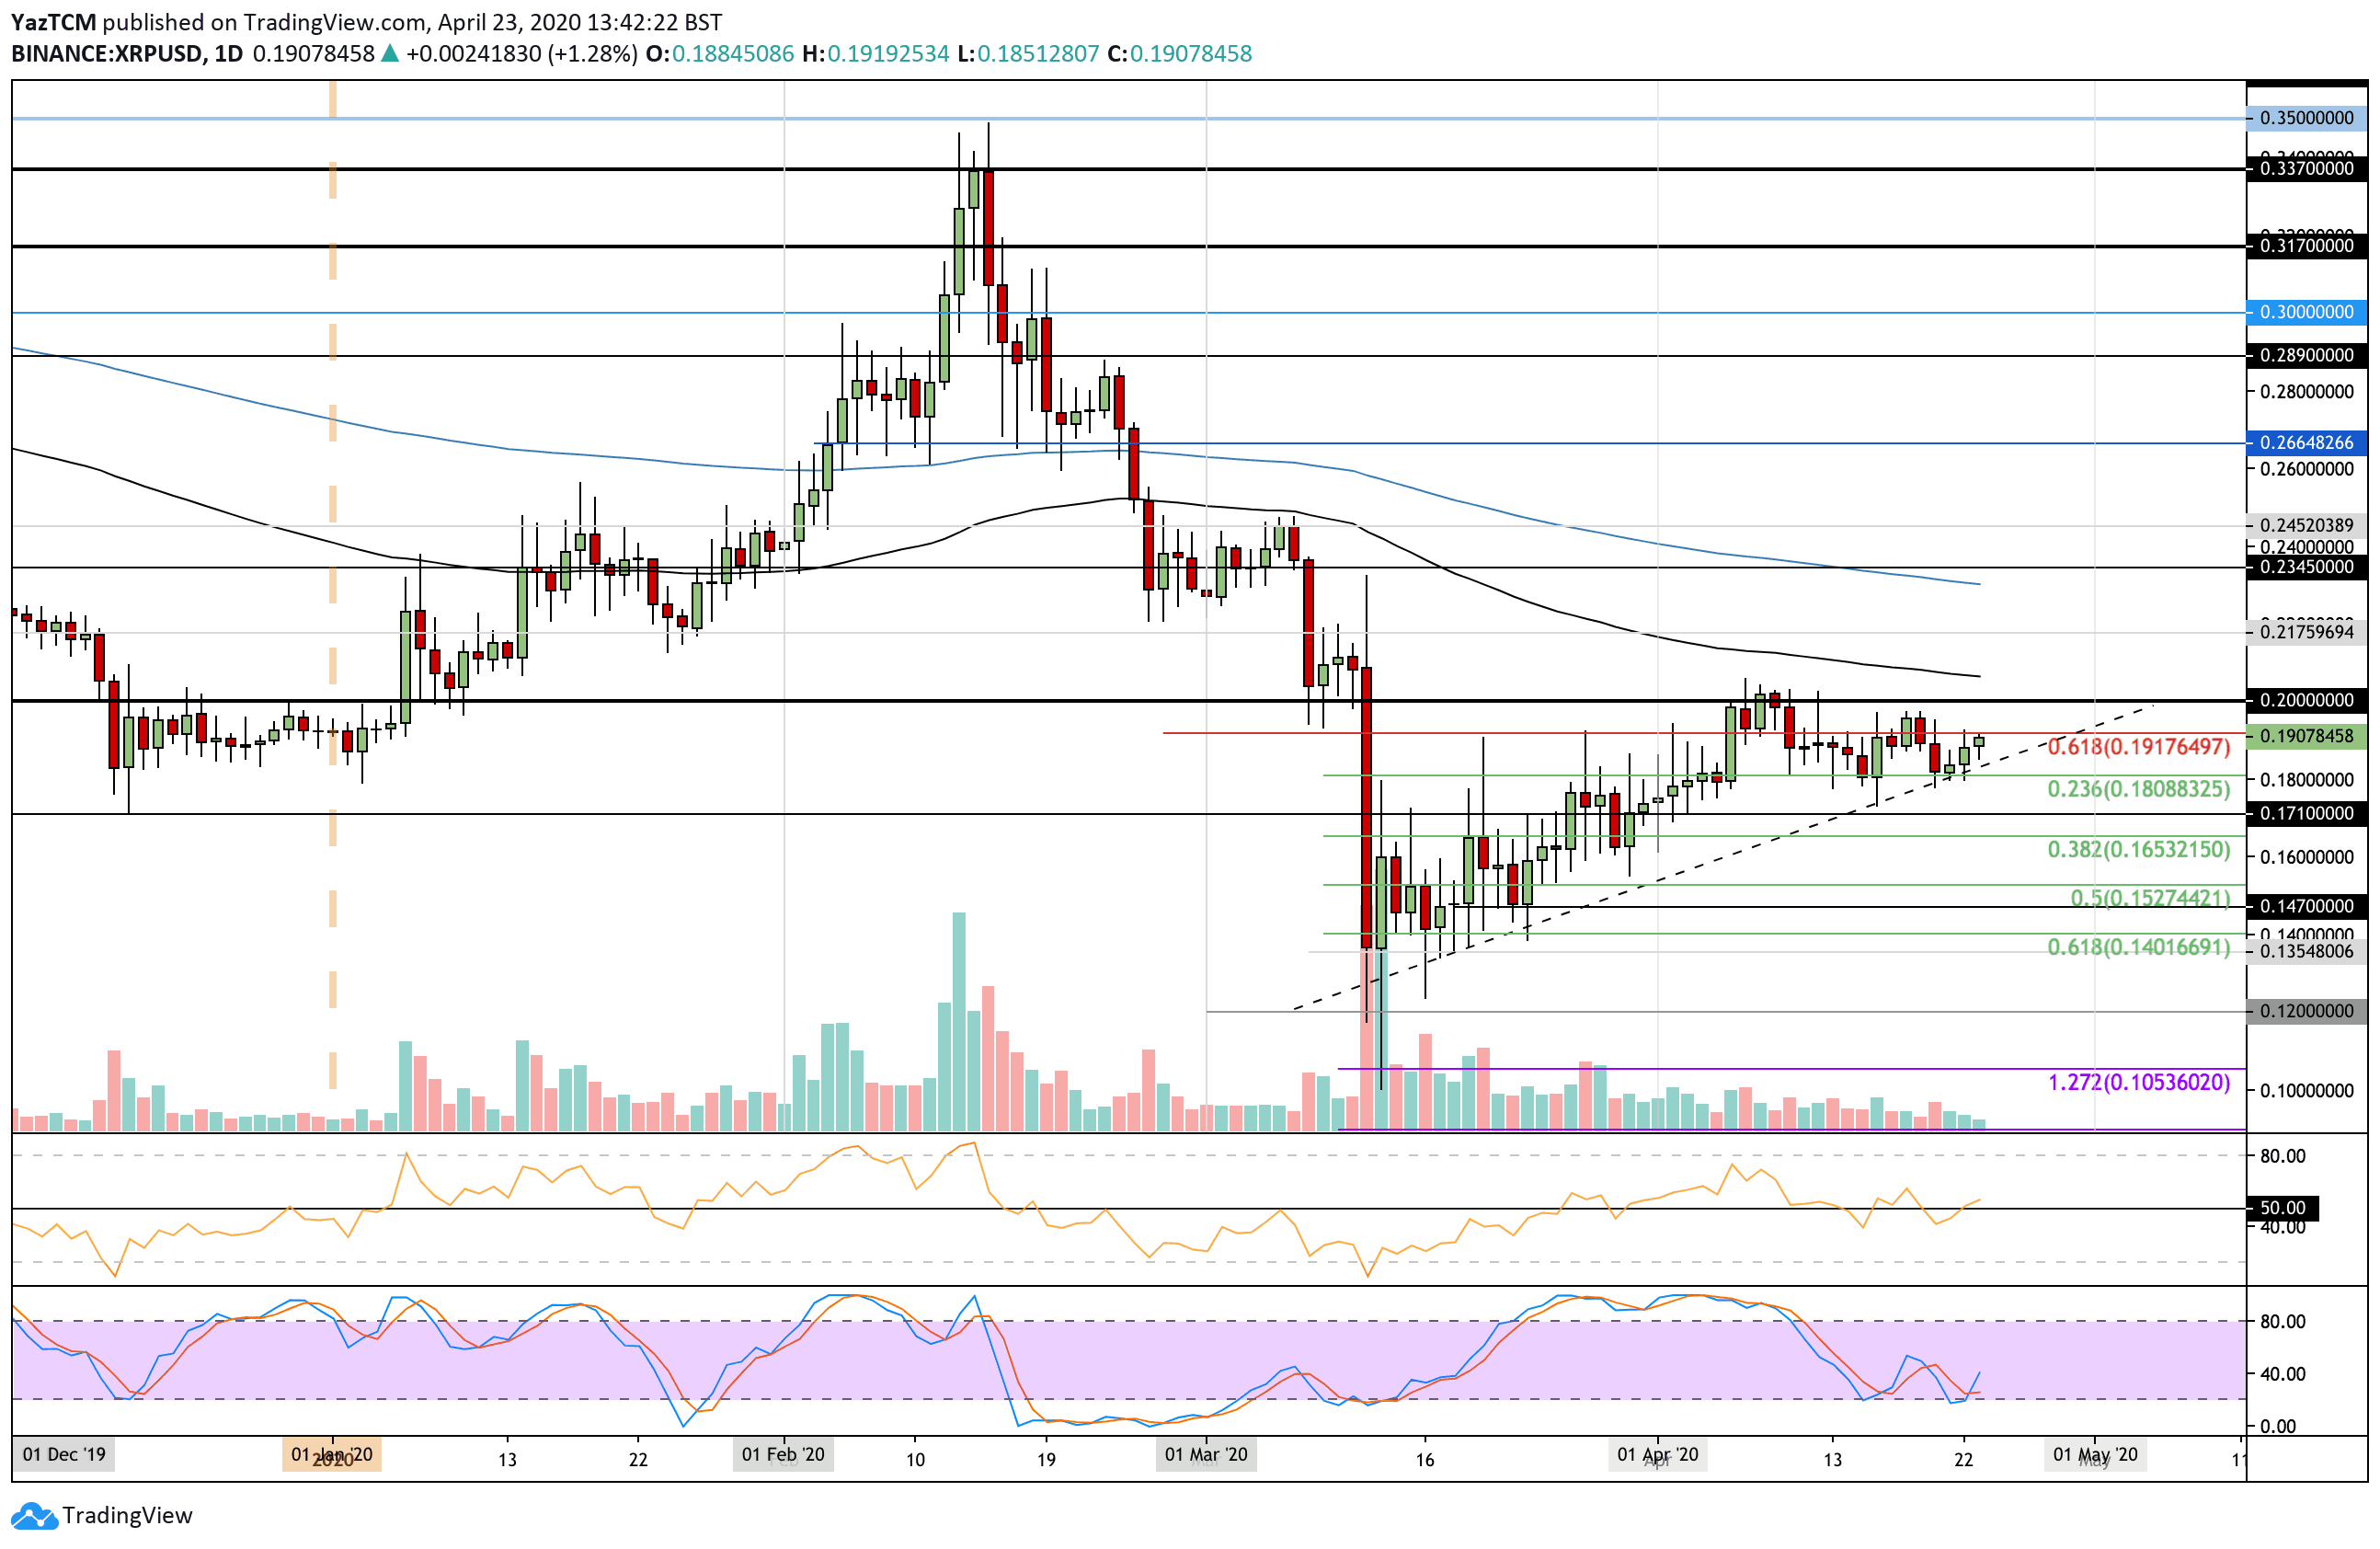
Support: $0.18, $0.171, $0.165.
Resistance: $0.191, $0.2, $0.208.
XRP/BTC:
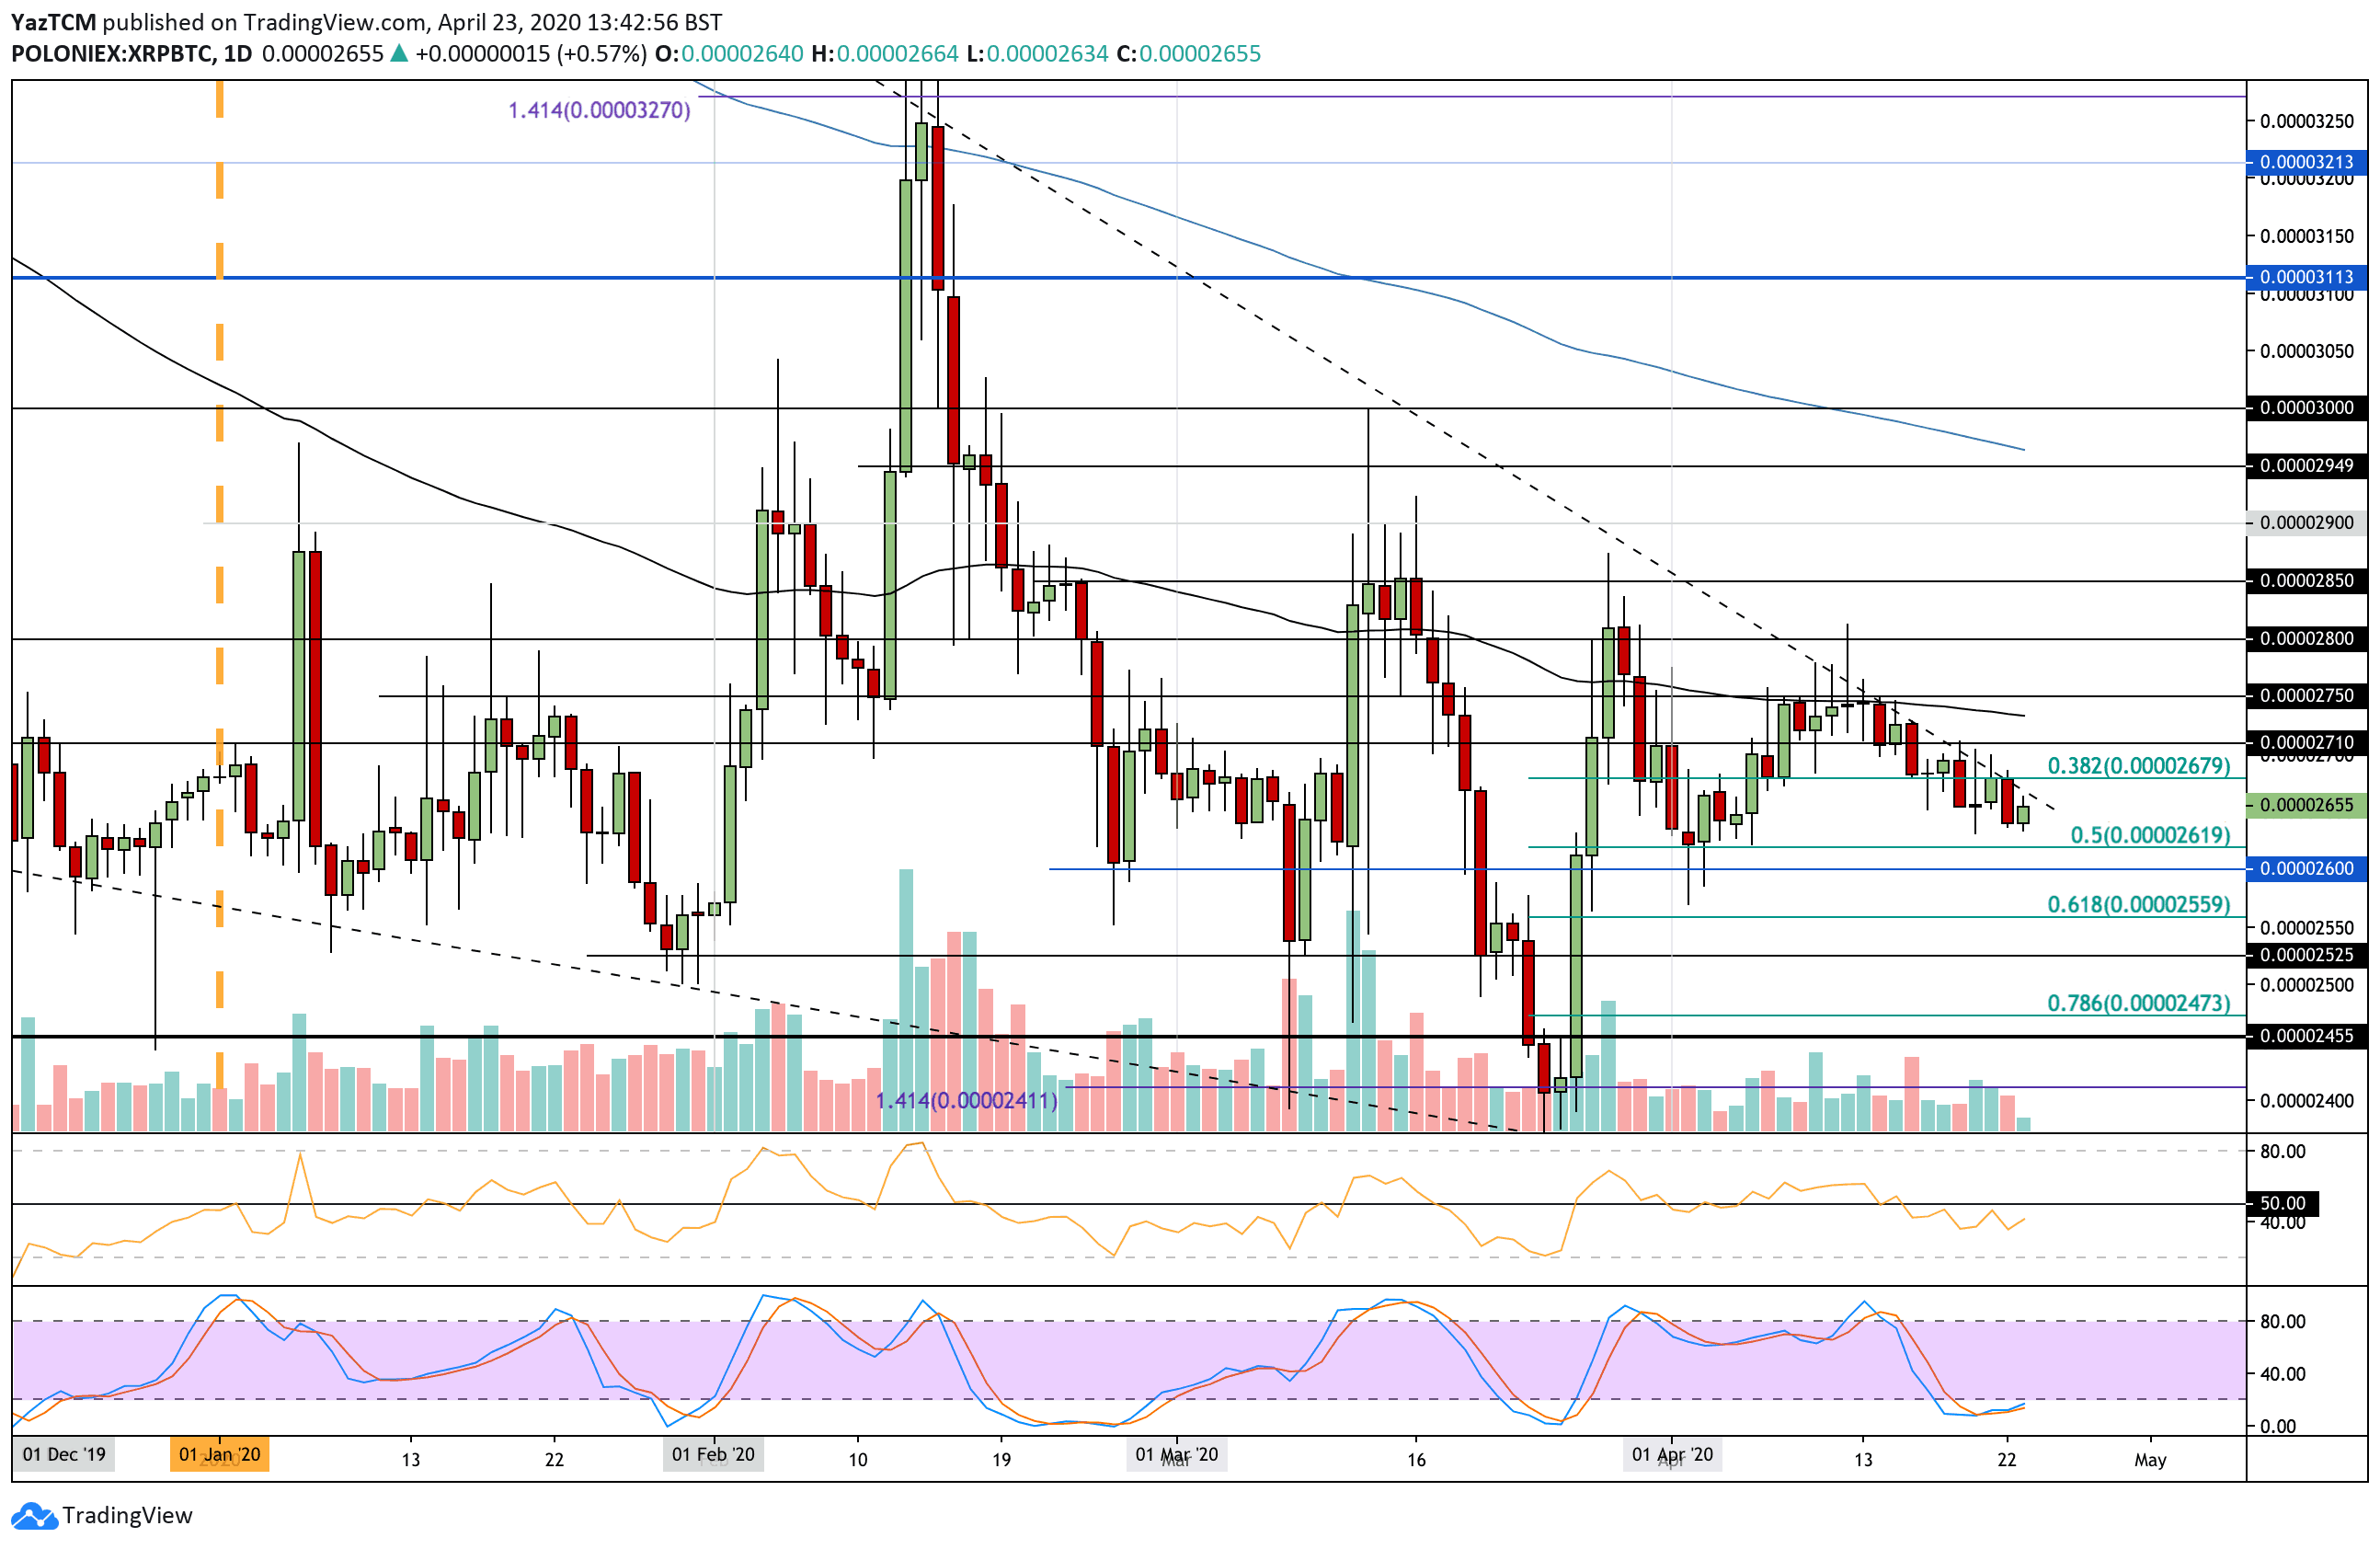
Support: 2650 SAT, 2600 SAT, 2560 SAT.
Resistance: 2710 SAT, 2750 SAT, 2800 SAT.
XRP was trending lower earlier in the week after reversing from $0.196. It fell into support at the rising trend line and managed to rebound from there successfully. This support was bolstered by a .236 Fibonacci Retracement level that lies at $0.18.
XRP is now trading above $0.19 but must penetrate above $0.20 for a bull run to begin.
If the bulls break the resistance at $0.191, the first level of strong resistance lies at $0.20. This is followed by resistance at $0.206 (100-day EMA), $0.217, and $0.23 (200-days EMA).
On the other side, the first level of support lies at the rising trend line. Beneath this, support is found at $0.18 (.236 Fib Retracement), $0.171, and $0.165 (.382 Fib Retracement).
The RSI has poked above the 50 line to indicate that buyers are starting to gain control of the market momentum. It will need to rise higher for XRP to continue toward the $0.20 level and break it. Additionally, the Stochastic RSI produced a bullish crossover signal, which is a good sign for the bulls ahead.
Against Bitcoin, XRP continues to trade beneath the falling trend as it has been doing for the past 12 days. The coin rolled over from resistance at 2750 SAT and started to fall every day as it failed to break the falling trend line resistance.
Most recently, XRP broke the support at 2650 SAT and hit 2630 SAT. However, it managed to climb back above 2650 SAT again. This trend line has to break if the price is to go higher.
If the bulls can break the falling trend line, the first level of strong resistance lies at 2680 SAT. Above this, resistance lies at 2710 SAT, 2730 SAT (100-days EMA), and 2750 SAT. This is followed by resistance at 2800 SAT.
On the other side, the first level of support is located at 2620 SAT. Beneath this, support lies at 2600 SAT and 2560 SAT.
The RSI remains beneath 50, which indicates the sellers are still in control of the momentum. However, the Stochastic RSI has produced a bullish crossover signal, and XRP should rise now if the signal can follow through.