Ethereum is approaching its all-time high aggressively, with the price on an almost vertical rise. Yet, based on both technical and sentiment analysis, a correction in the short term is looking probable.
By TradingRage
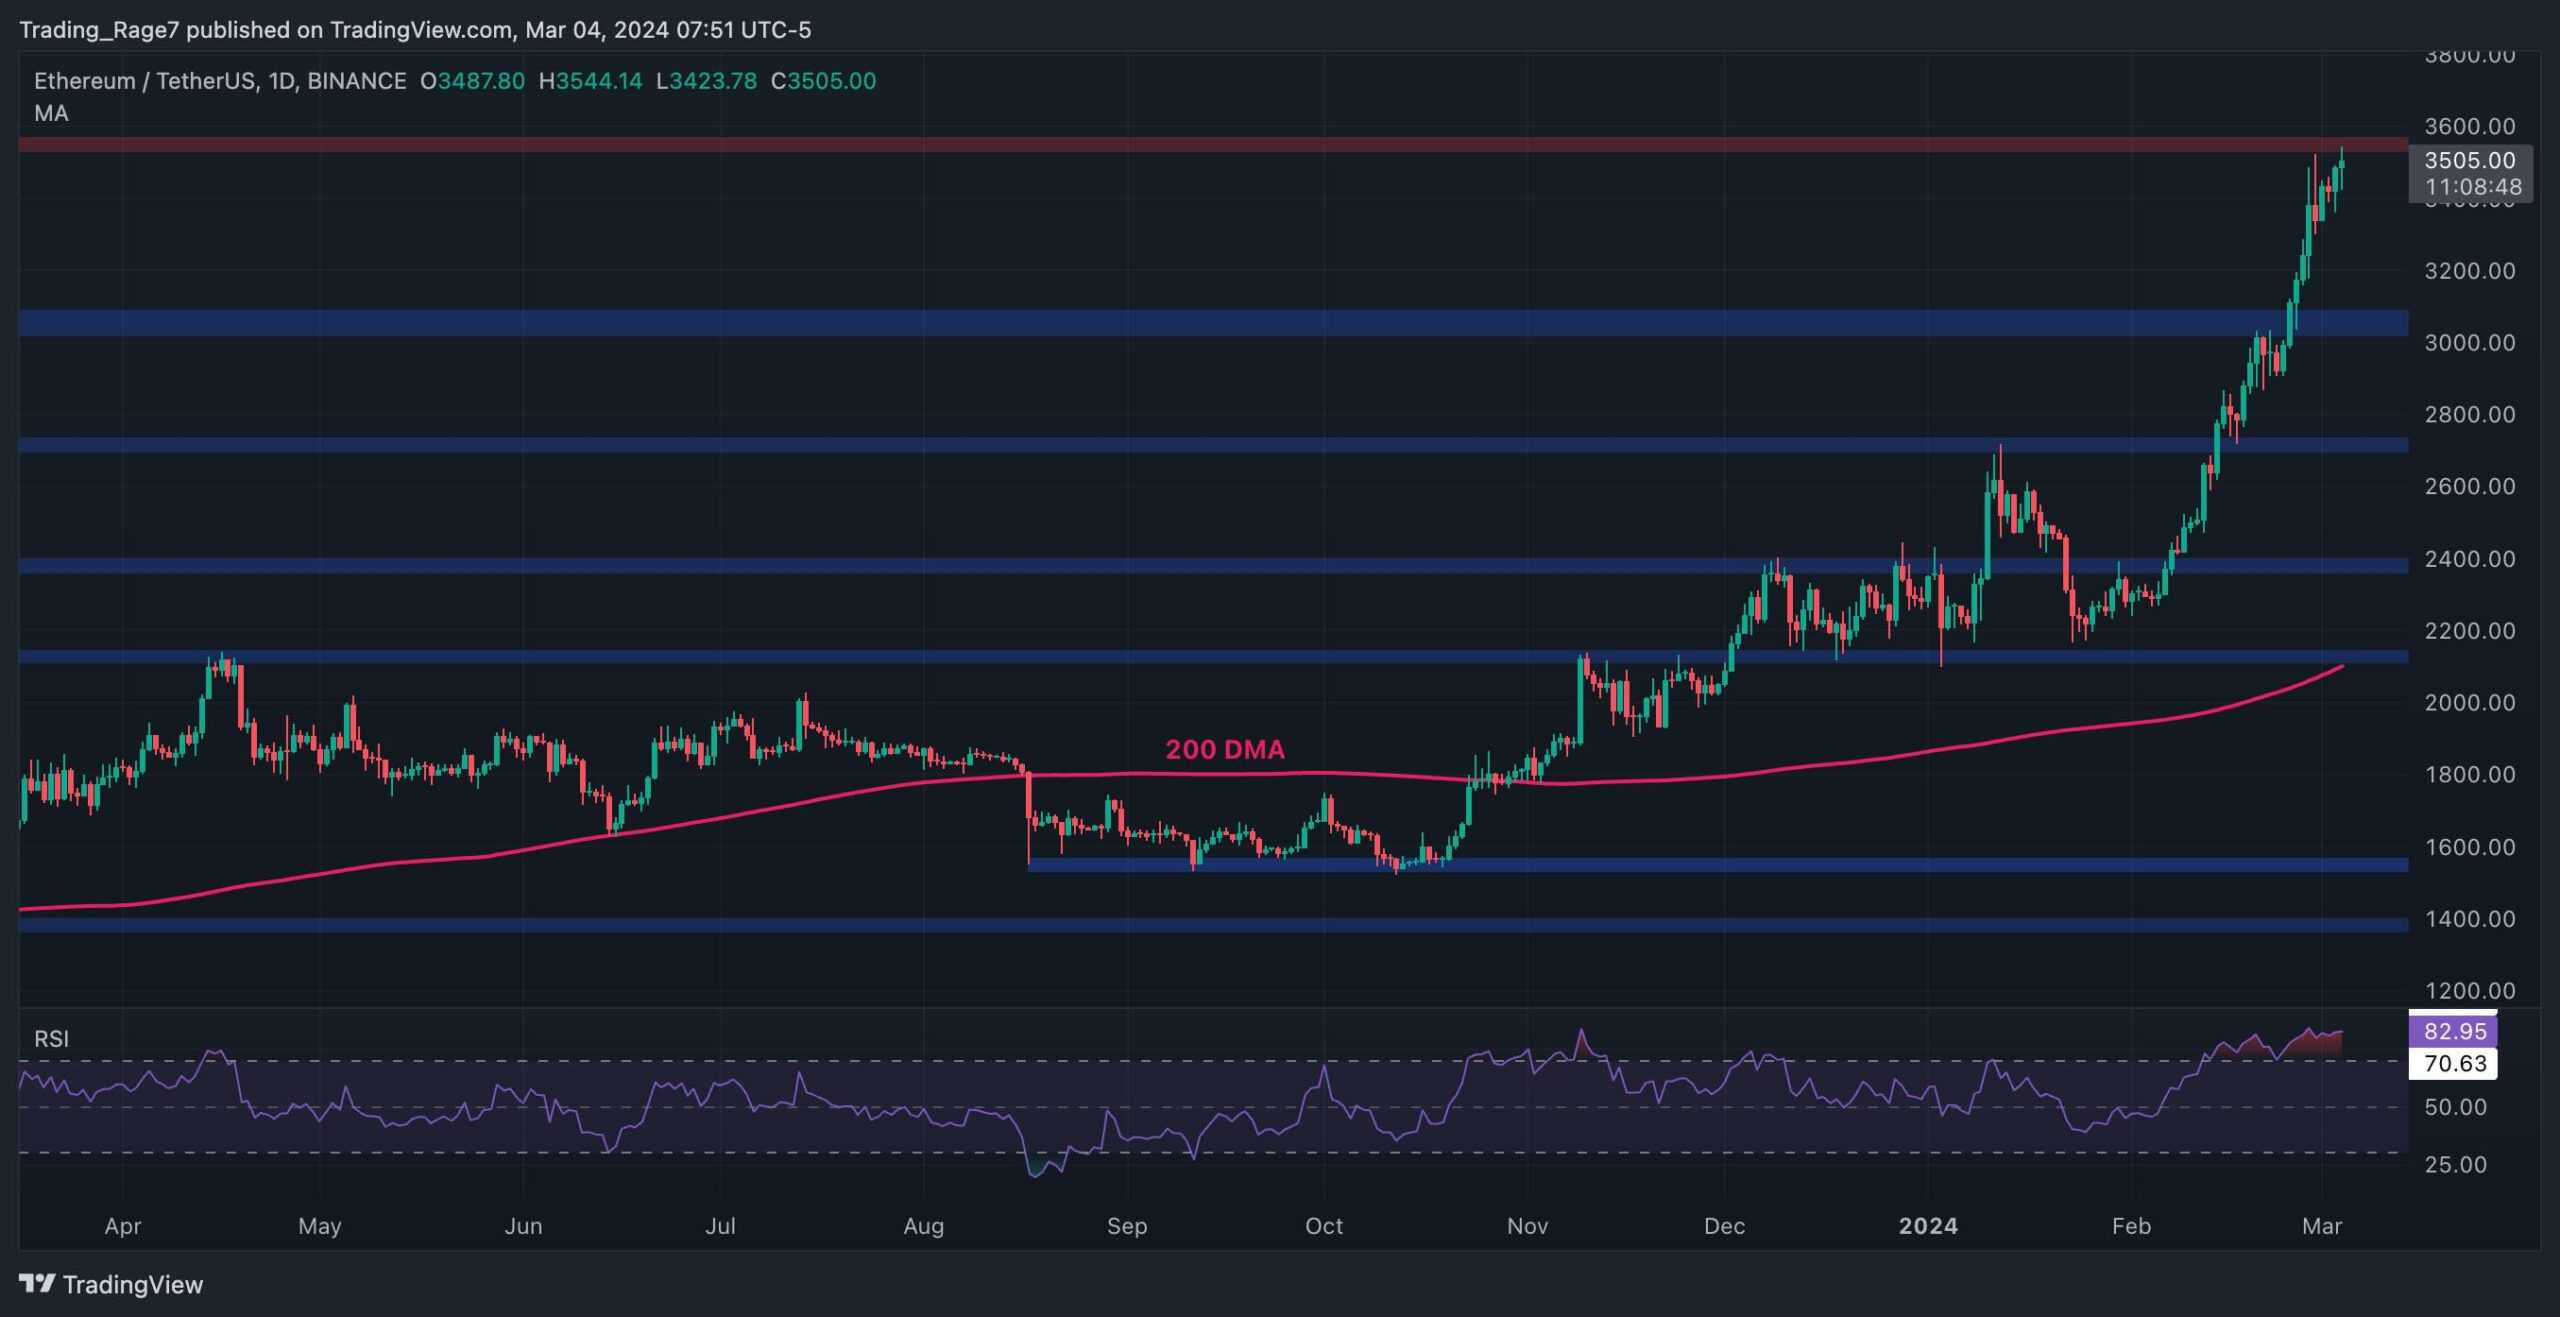
On the daily chart, the price has been blowing past several resistance levels since rebounding from the $2,200 level at the beginning of February. The market is currently testing the $3,500 resistance level and is yet to break to the upside definitively.
Meanwhile, the Relative Strength Index demonstrates a clear overbought signal pointing to a potential consolidation or pullback in the coming days. In this case, the $3,000 level can provide sufficient support to prevent a deeper drop.
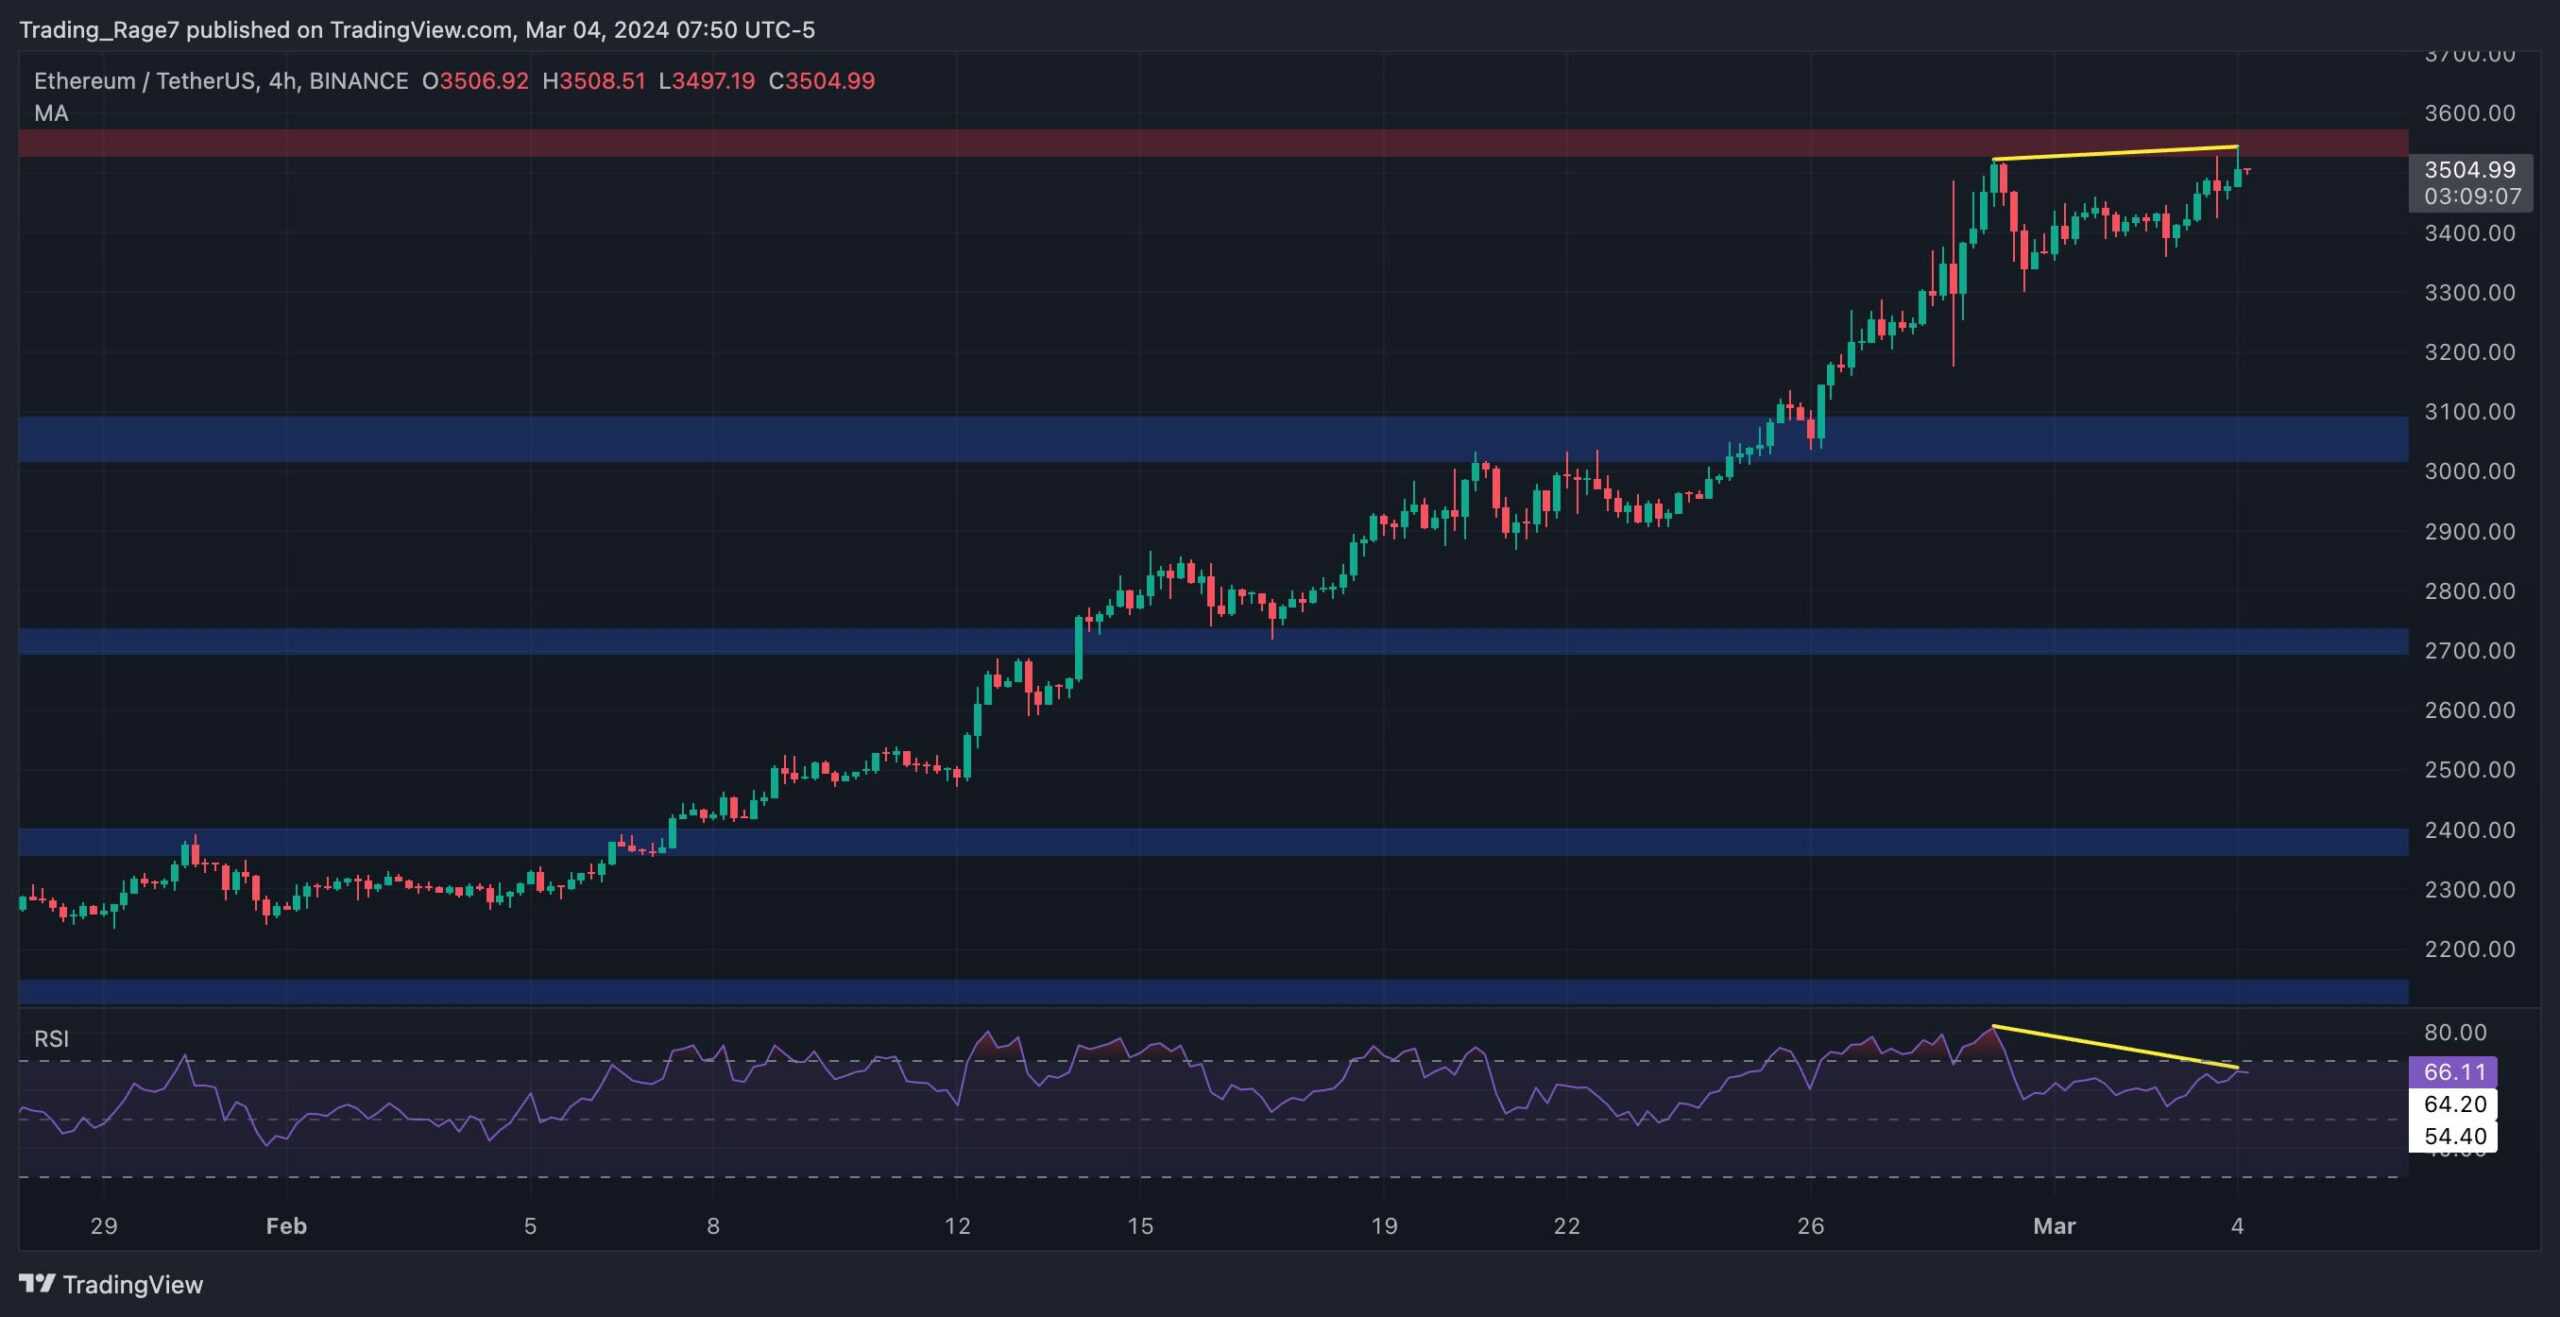
Looking at the 4-hour timeframe, the price has recently demonstrated signs of weakness, failing to break above the $3,500 level.
The Relative Strength Index also demonstrates a bearish divergence between the two recent highs. As a result, another rejection from the $3,500 level might occur, leading to a correction toward the $3,000 zone.
By TradingRage
Ethereum’s price has been rallying rapidly over the last few weeks, approaching the $4,000 mark. This has led many speculators to jump on the crypto wagon once more and chase substantial profits.
This chart represents the open interest, which is a useful metric for futures market sentiment evaluation. It measures the number of open perpetual futures contracts across all crypto exchanges.
The open interest has also been experiencing a steep rise during the recent bullish run. While we have already concluded that there is a logical reason for this trend, high open interest values tend to result in increased volatility.