Shiba Inu started a major rally last week and this week it seems keen to continue. In the following, we take a look at a few technical indicators that might provide some insights into why SHIB’s price is up today.
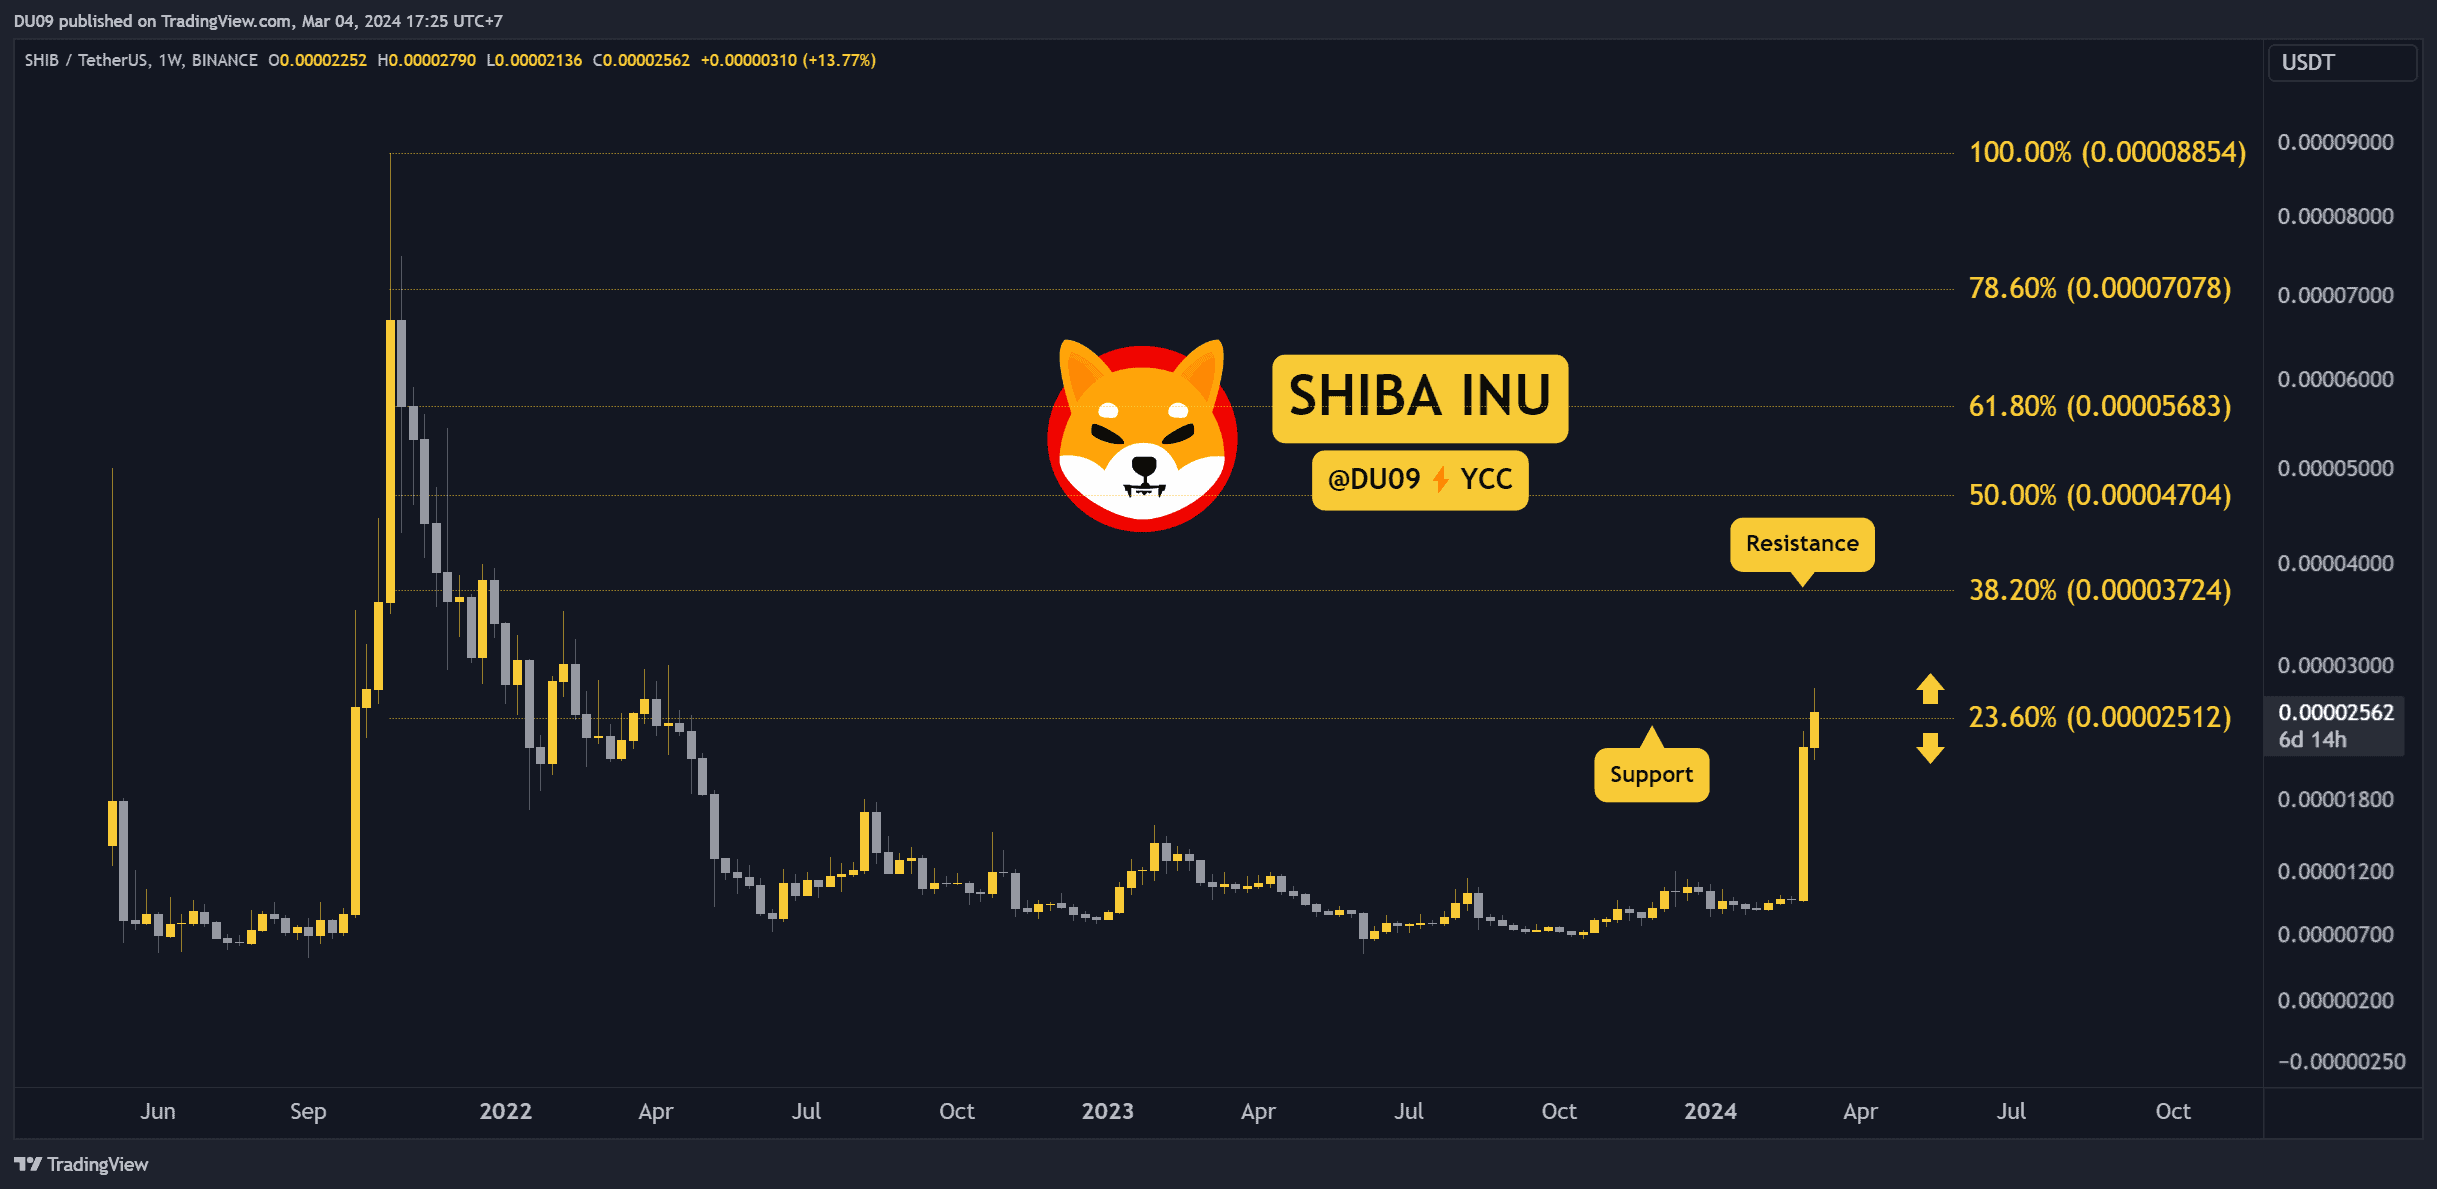
Key Support levels: $0.000025
Key Resistance levels: $0.000037
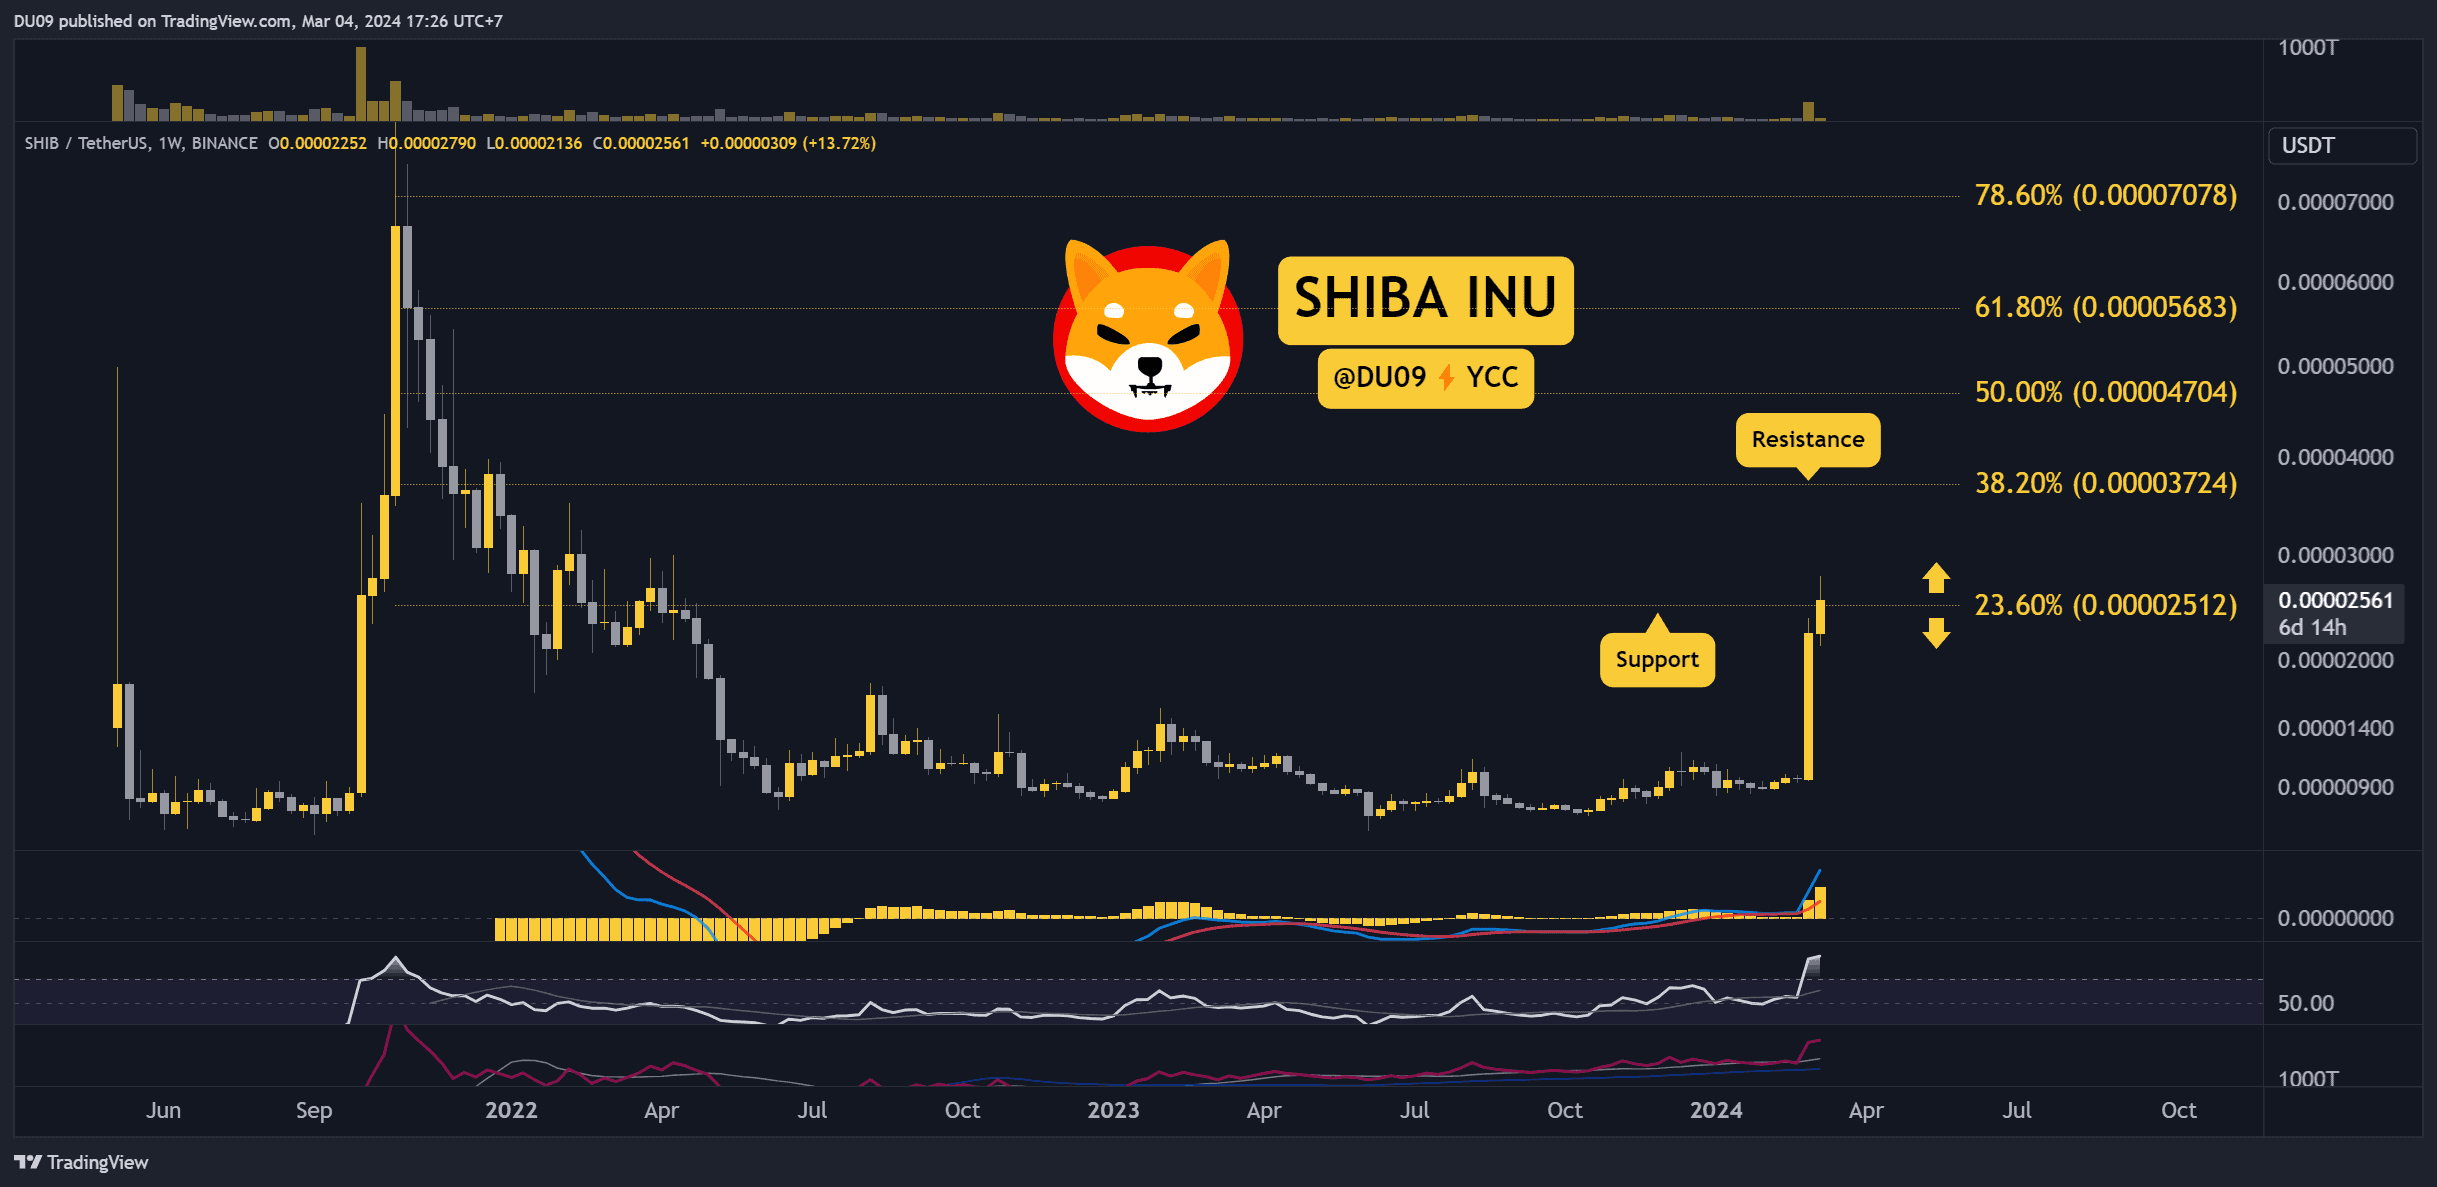
After more than a year of sideways price action, SHIB has finally returned to the spotlight with a massive rally that started at the end of February. Since then, the price tripled and appears determined to go higher as seen on the below chart.
The resistance at $0.000025 did not last and soon turned into a key support. This opens the way for SHIB to continue towards its current target at $0.000037. That’s “only” a 37% price increase from current levels.
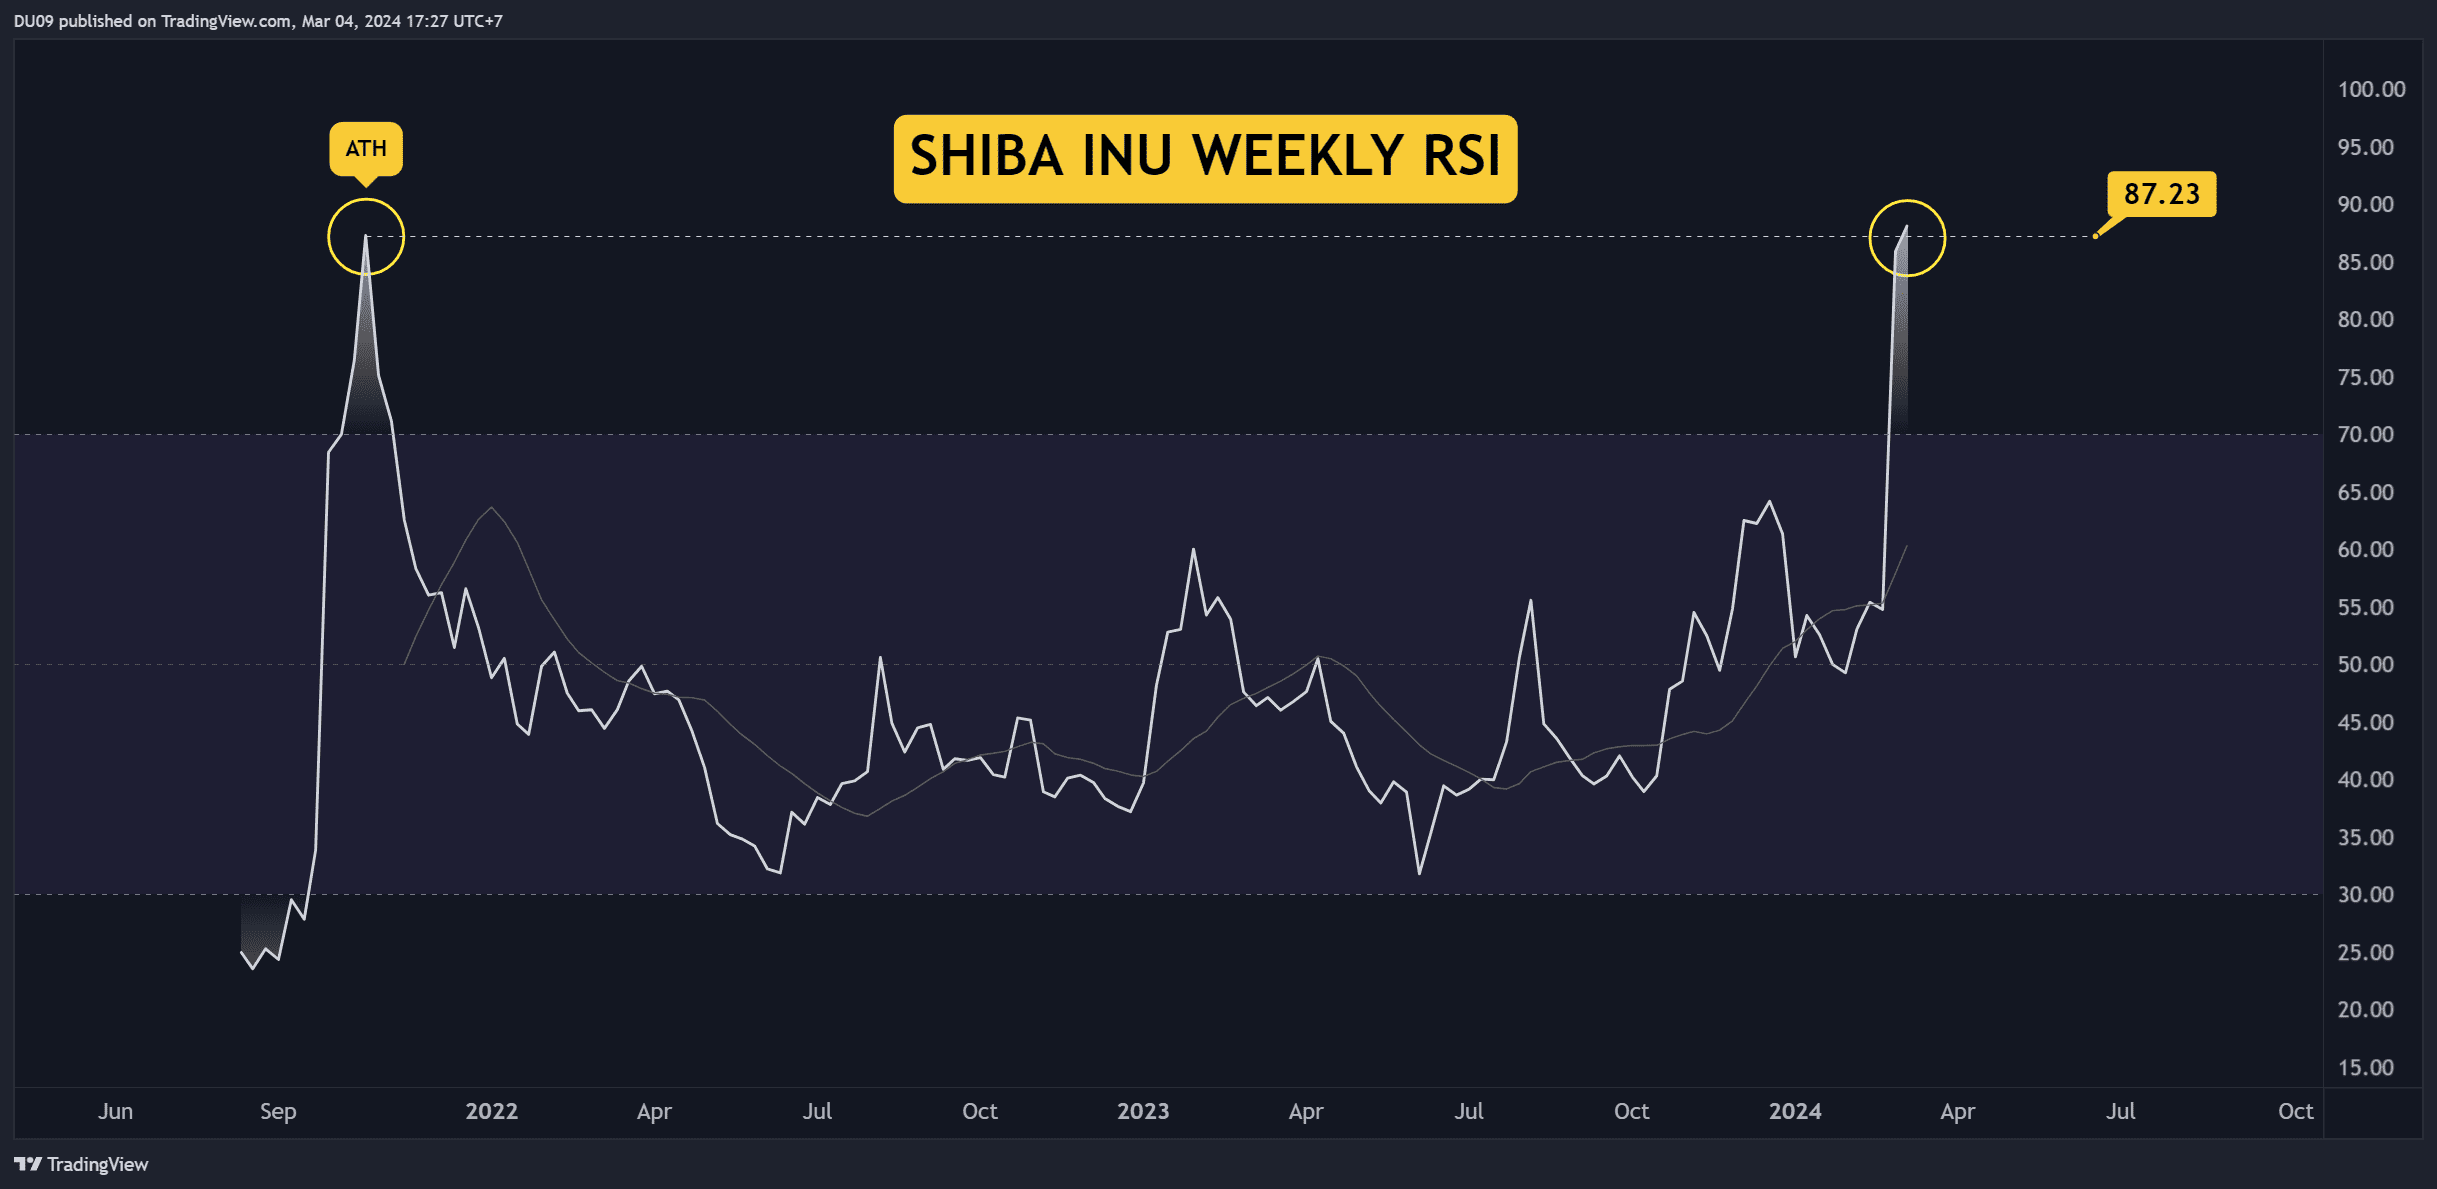
While the price action remains bullish, the weekly RSI is at a historic level. It hovers at over 87 points, higher than the all-time high from October 2021. We need to be patient and see if this is a top signal or only the beginning.