TL;DR
Technical analysis in the cryptocurrency space, or any market for that matter, is complicated. Influencers and analysts often spout out enough terms and phrases to make a newcomer’s head spin. One such term is the dreaded “death cross.”
The death cross is commonly touted as an ominous sign during downward crypto price action, indicating possible further significant downward movement. The event occurs on price charts when two specific moving averages intersect on a path downward.
In technical analysis, three moving averages (MA) are commonly referenced in their relation to price: the 50-period MA, 100-period MA, and the 200-period MA. The 50-day MA and the 200-day MA appear to be the most commonly used MAs when looking for a death cross.
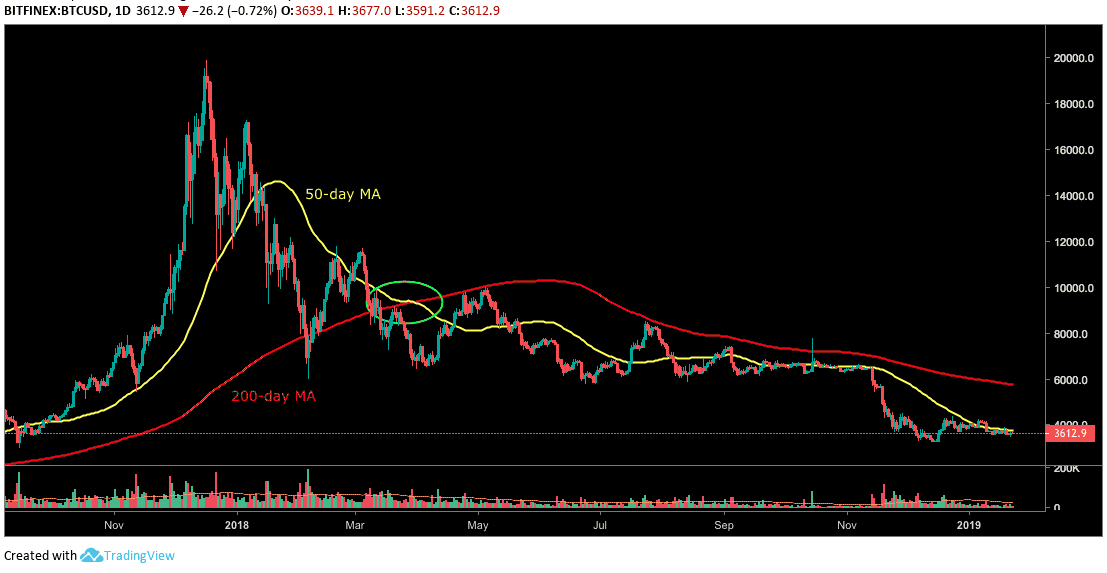
In the crypto space, bitcoin’s death cross earlier this year appears to have been a powerful turning point for crypto’s previously bullish trend, as seen in bitcoin’s daily Bitfinex chart below (with the death cross circled in green). The crypto market still shows signs of an intense bear market almost ten months after bitcoin’s daily MA death cross.
After the death cross, the price can be seen approaching the red 200-day moving average several times although each attempt faced rejection.
Like any technical analysis tool or method, the death cross is not foolproof. Many technical indicators can also fall prey to price fake-outs.
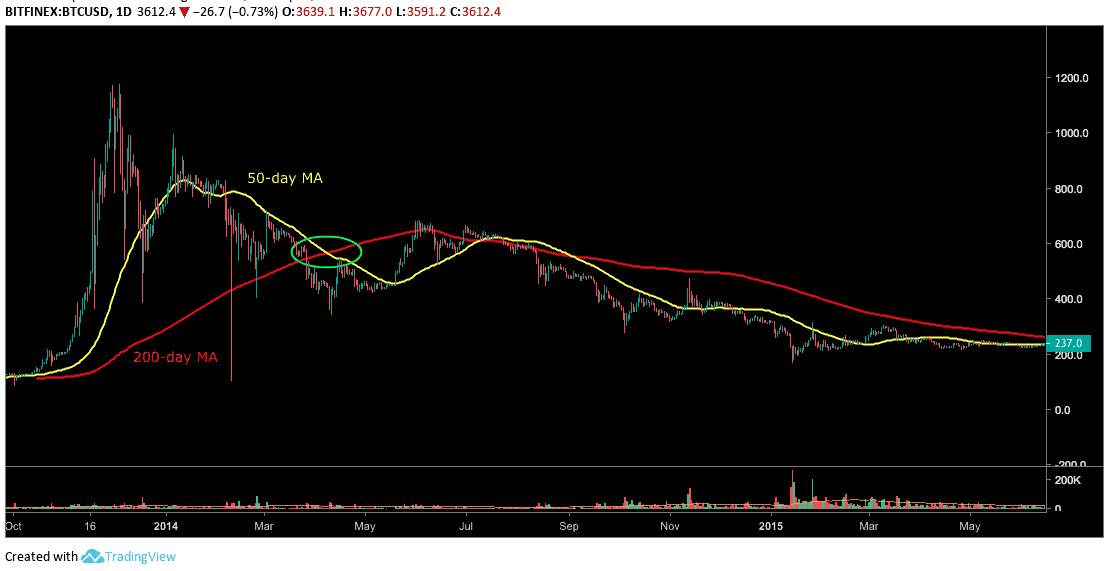
Bitcoin’s last bear market also posted a death cross. In this example, however, the 50-day MA crossed back above the 200-day MA for some time before returning below the 200-day MA.
Inversely, the Golden Cross occurs when the 50-period MA crosses above the 200-period MA, possibly indicating bullish sentiment and future bullish action.
Even the best technical analysis often may only provide a slight advantage in anticipating future price action. Additionally, technical analysis is a game of confluence. Many price clues in congruence often rule over a single clue.