The day began with positive news regarding an evolving Trade War deal. Shanghai has already reacted to the above report with heavy green, while Europe exchanges have not. Today could have been the 2800 break-out day of the S&P. At least at the beginning, it looked like it’s happening following a 0.4% gains (S&P 2816.88).
As the trading went on, the indices lost momentum, and around mid-day, the numbers showed drops of 1.2% – 1.5%. Call it reversal candle; it doesn’t look good for the bulls. Towards the end of the trading day the market had recovered, led by the technology stocks, and the closing was above support lines (as for today).
S&P dropped by 0.39%, closing at 2793 following a daily high of 2816. Yes, that’s a tough resistance. The index later touched support around the 2770 levels and recovered a bit till the end of the day. Support: 2770, 2750 (200-days moving average line), 2710-5. Resistance: 2815-2820, 2860.
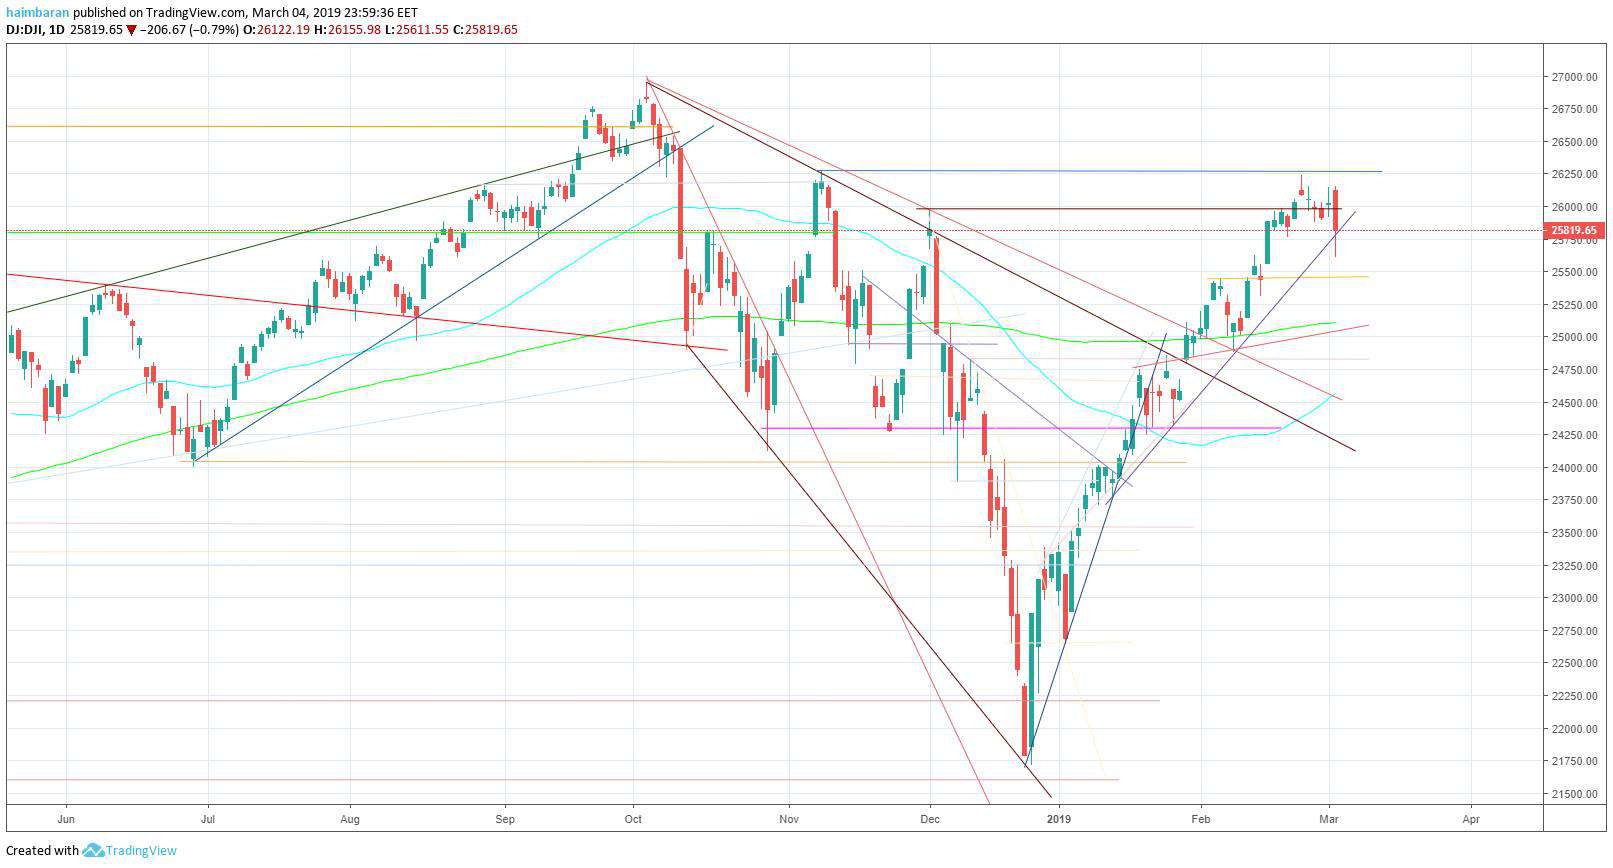
Dow Jones dropped 0.79% to 25819. The buyers only showed up around the 25600 area. As seen now, there is a slight break down of the Dow’s two-month support line. Support: 25450, 25000-100, and 24800 Resistance: 25850-900, 26000, 26250-300.
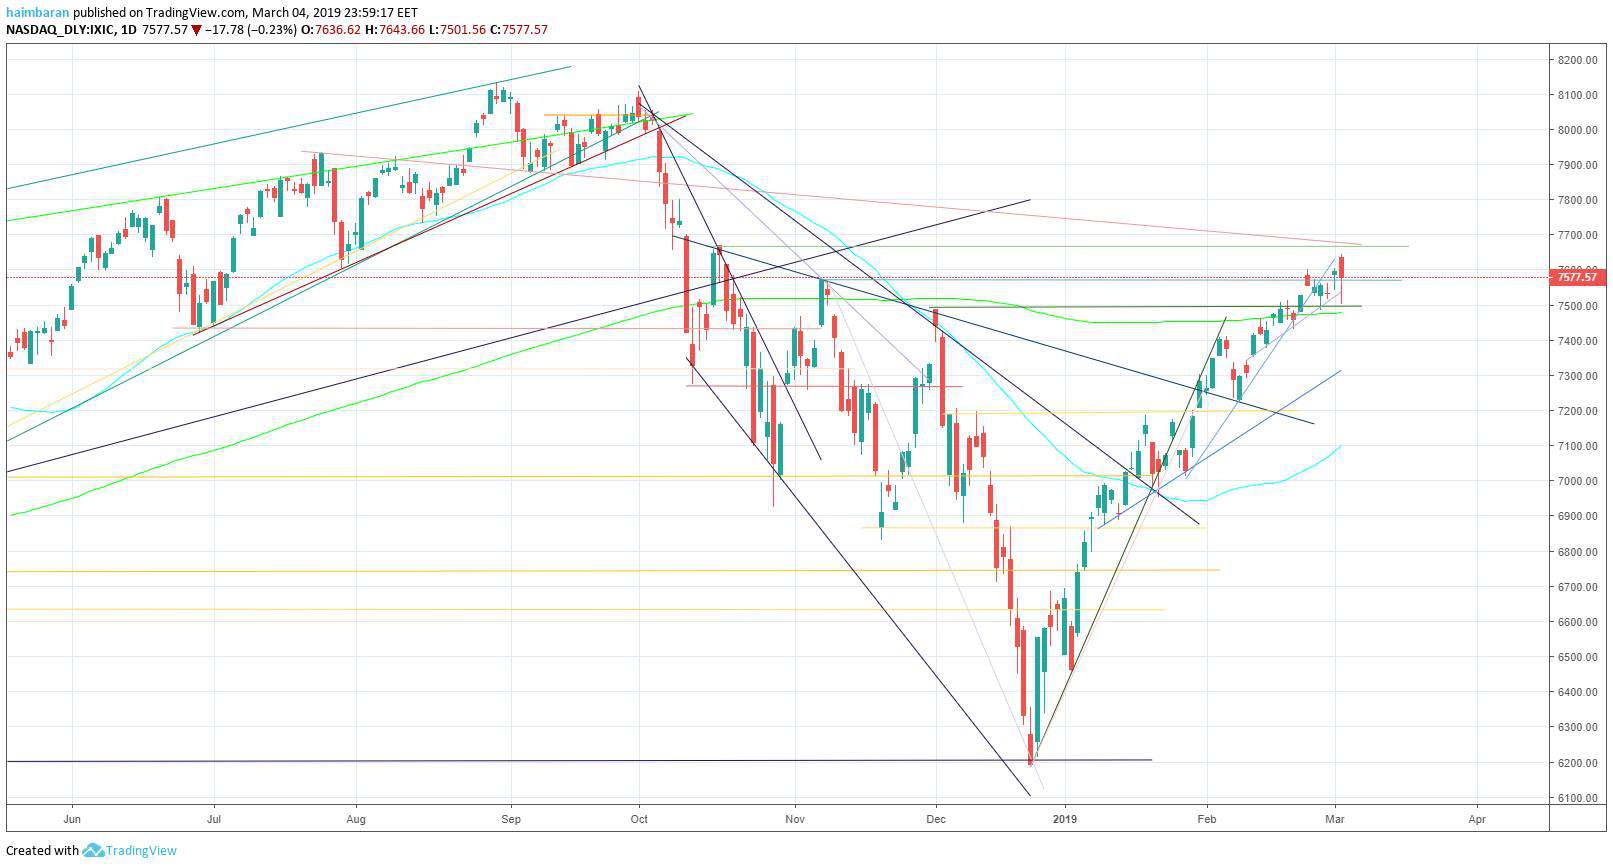
NASDAQ was the strongest index in today’s trading, and decreased only by 0.23% to 7577, following resistance level at 7640. Throughout the day, got support at 7,500. Support: 7475-7500, 7400, 7200. Resistance: 7640-70, 7750, 7900.
To conclude today’s trading, the market broke down important intraday support lines, however, partly recovered. Today’s candle looks like a reversal candle despite the come-back. It felt like as pulling off carpet below your feet and returned it, so now it’s less tight to the floor.
To my opinion, there will be a confirmation of breakdown – only by closing below today’s lows. On the other hand, if the market will hold, we could turn bullish. So in my opinion, we are going for a third attempt to break, which, by the way, most reliable breaks occur only following at least three attempts. And still, the S&P could still maintain bullishness in case of not losing the 2750 support line.
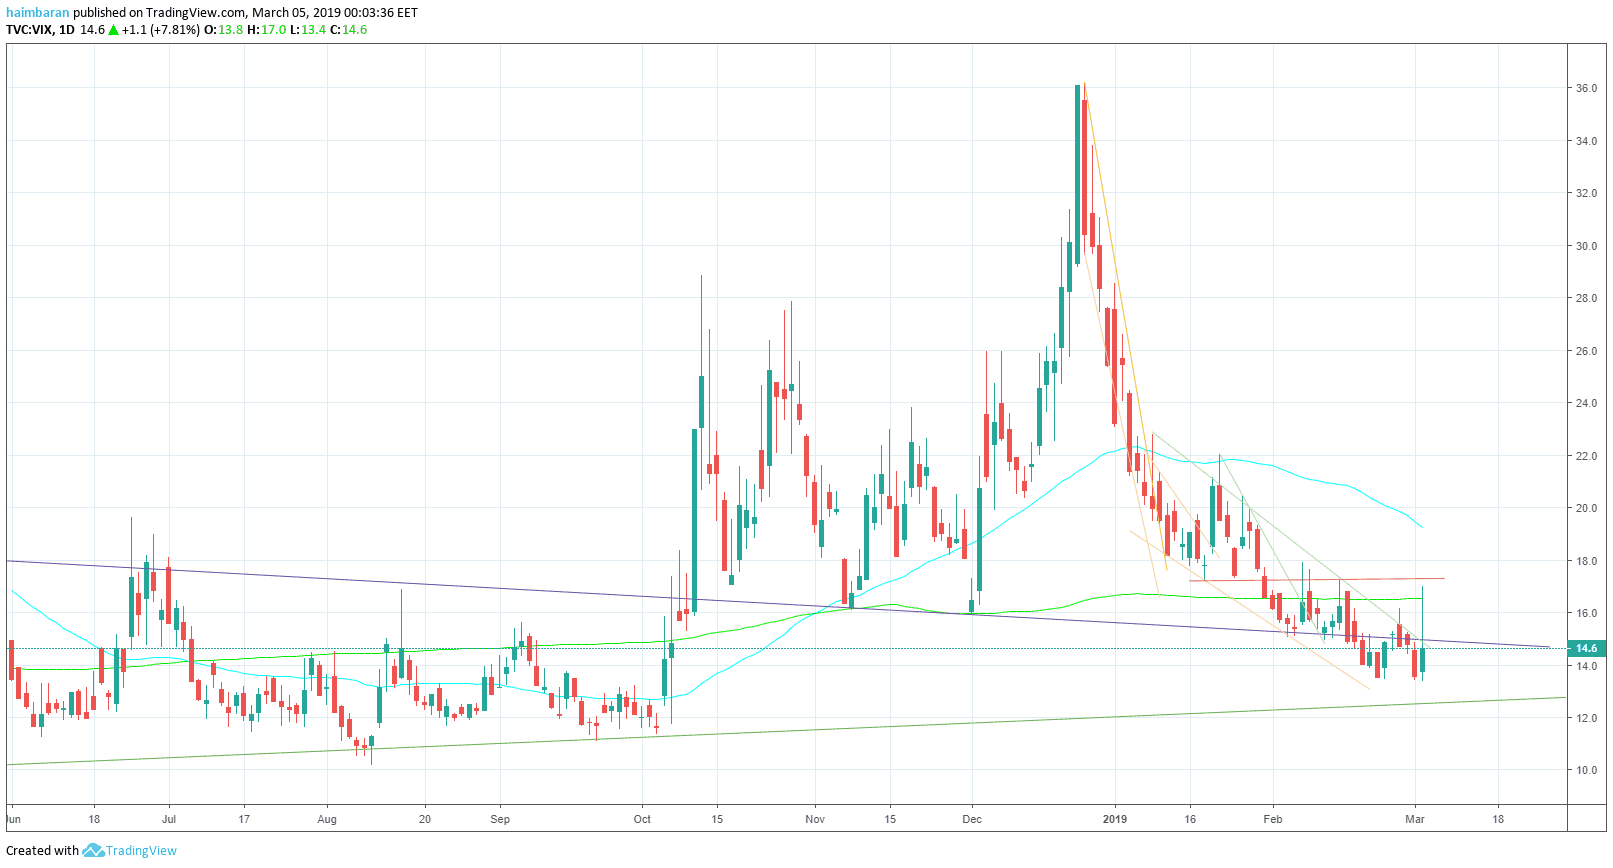
What should worry is the VIX: The fear index made a stunning surge from 13.5 To 17 before closing at 14.6, which is still considered a “safe zone.”
Some other signs to look on is the flow of funds into the market which dropped, and Gold, which had also decreased significantly.
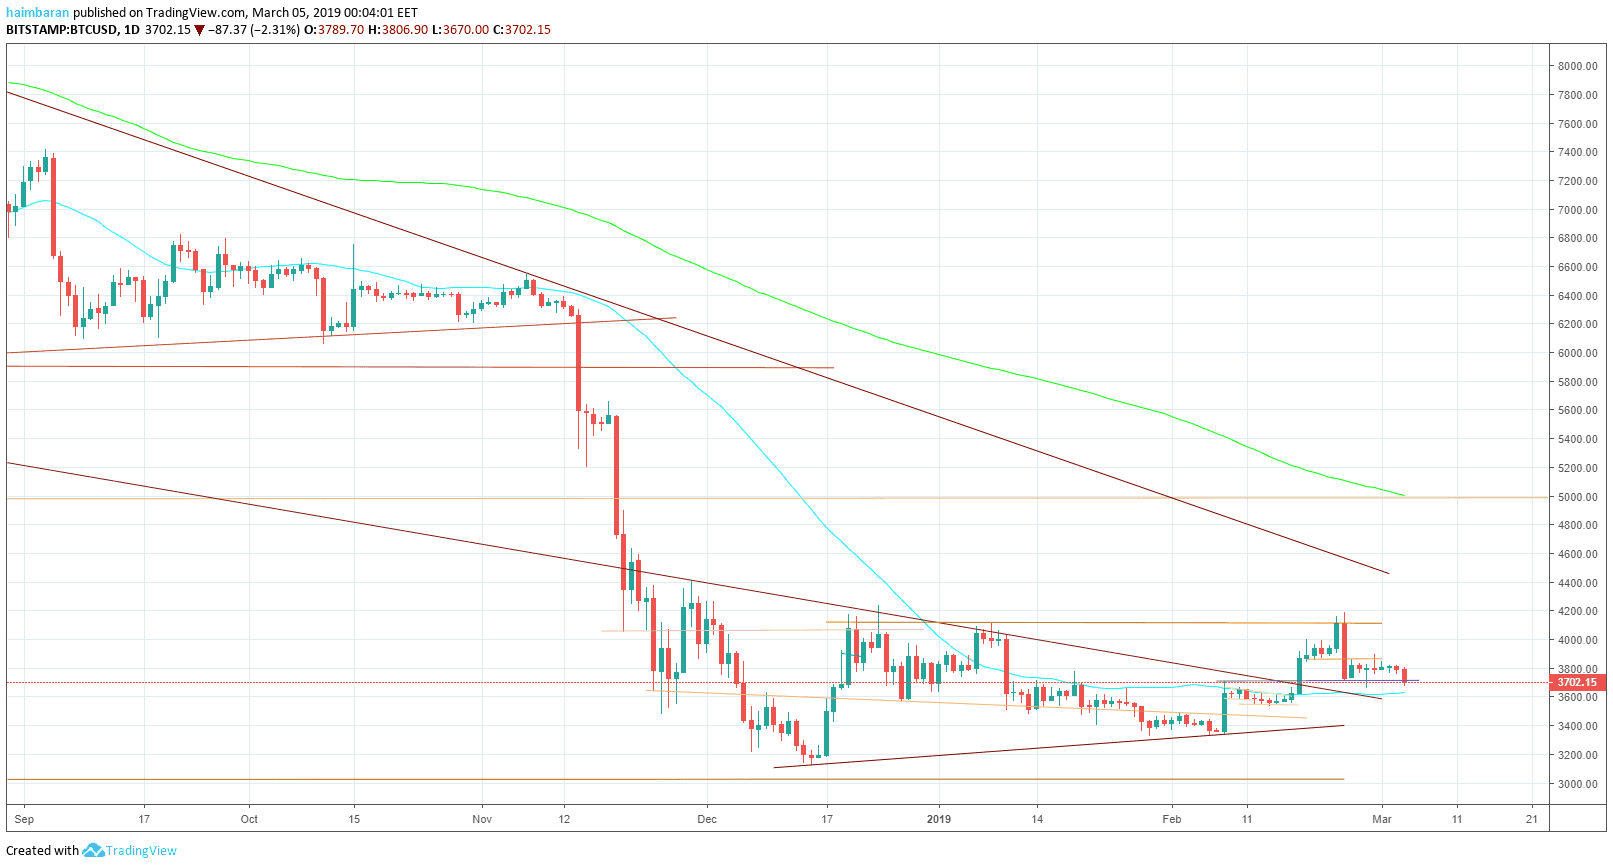
Also, the cryptocurrencies also have hard times, following a Bitcoin price drop to $3700 support, while Ethereum had lost 7% over the past day. Oil is struggling and has difficulties to climb above $57.50.
Some optimism is coming from the interest rate side. In 2018 the talk regarding raising the rate would have taken the market to severe drops. However, this doesn’t seem to affect much.
Green: ASND +74% (following acquisition), ZTO +8%, MYOK +7.3%, VIPS +5.1%, RETA +5%, BILI +4.7% (correction).
RED: ENDP -17%, HCG -13.1%, FMC -12.7%, PLCE -10.3%, MDB -7.1%, OKTA -8%, GWRE -7.8%, AYX -7.8%