Bitcoin’s price action has been relatively stagnant over the past few days. The market is still hanging around the $30K level, but this consolidation phase will not continue forever.
By: Edris
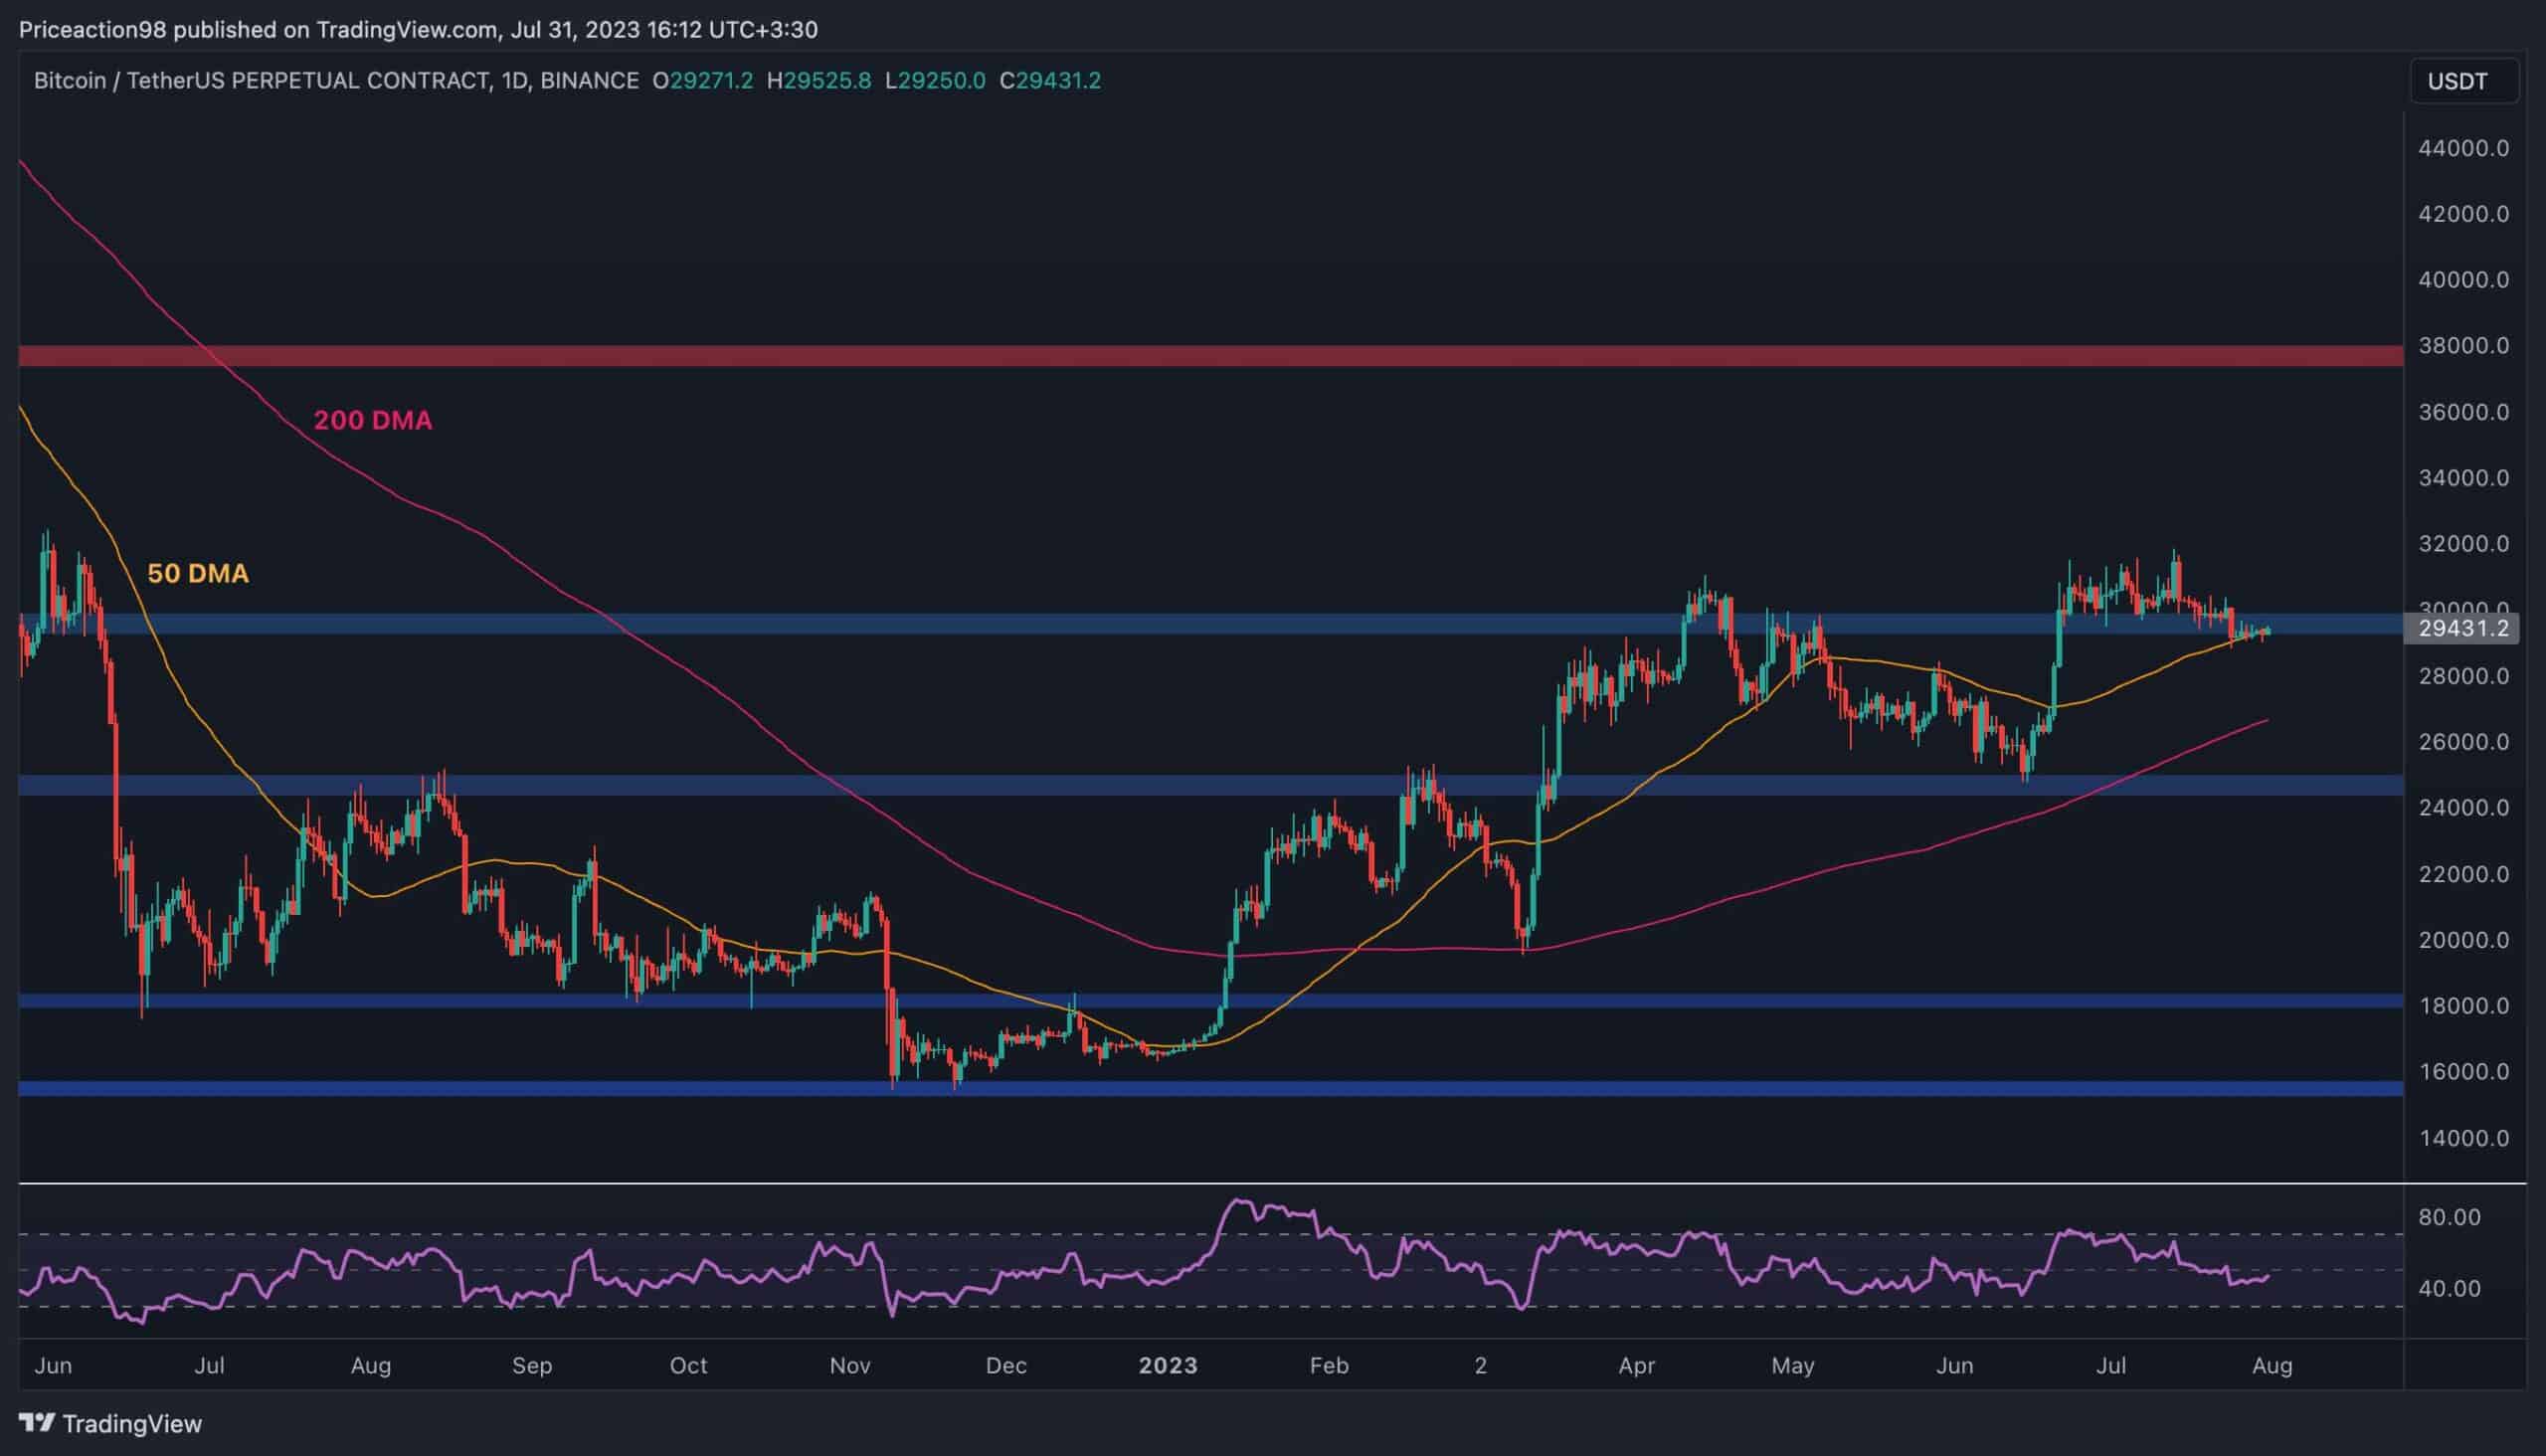
On the daily chart, the 50-day moving average is currently holding the price around the $30K level. However, it has failed to push the market back above the $30K mark over the last few days.
There is a probability for the price to break to the downside and drop towards the 200-day moving average located around the $27K mark.
The 200-day MA is a key indicator and might push the price higher once more, as it did back in February. On the other hand, if the price climbs back above the key $30K level, a rally higher and an eventual test of the $38K resistance zone could be expected in the next few weeks.
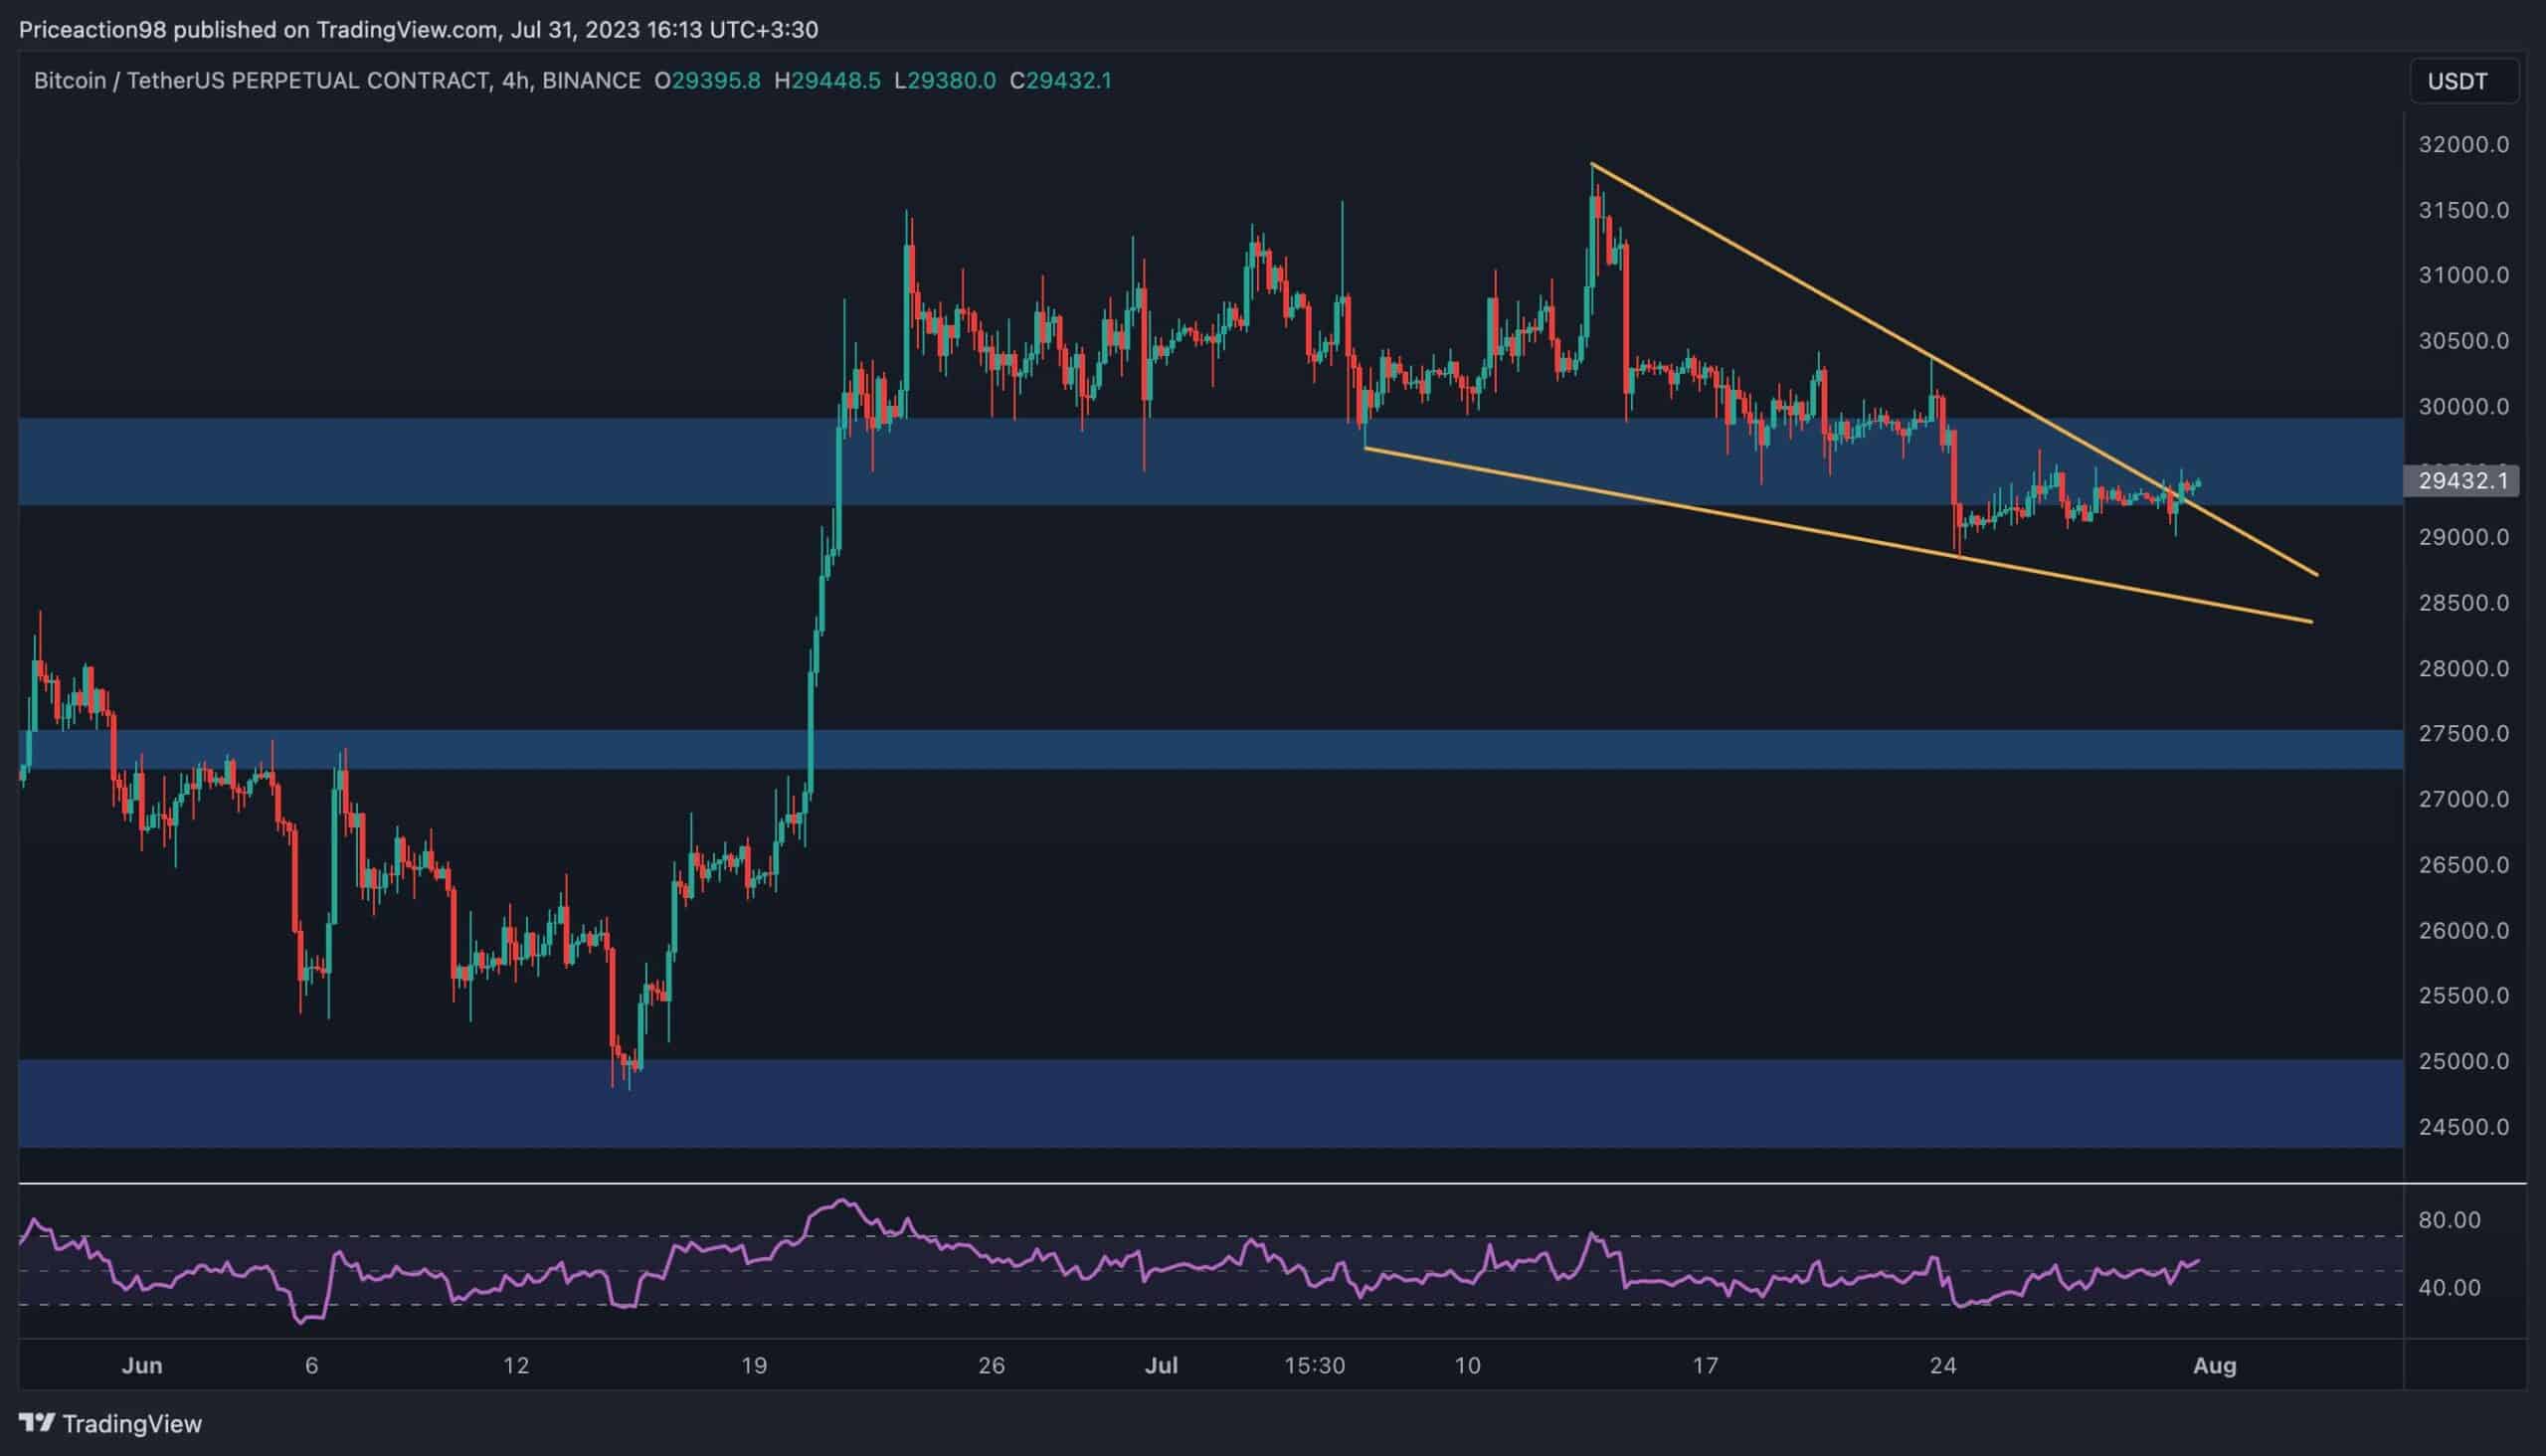
Looking at the 4-hour chart, things appear more interesting for BTC. A large falling wedge pattern has been forming since the beginning of July. However, the price is seemingly breaking out to the upside. If the breakout is valid, the market is likely to enter a new bullish phase and surge higher.
Yet, there is still a chance for the breakout to be a fake one, which would be disastrous.
Fake breakouts usually lead to massive crashes, and in this case, might result in a rapid decline towards the $27,500 support level in the short term. Nevertheless, with the RSI indicator showing values above 50%, the momentum is in favor of buyers, and a bullish move is looking more probable.
By: Edris
Bitcoin Funding Rates
Bitcoin’s price has shown little intention of rising or falling and has been consolidating around the $30K level for the last few weeks. While the action fails to give any clues, analyzing the futures market sentiment might be insightful.
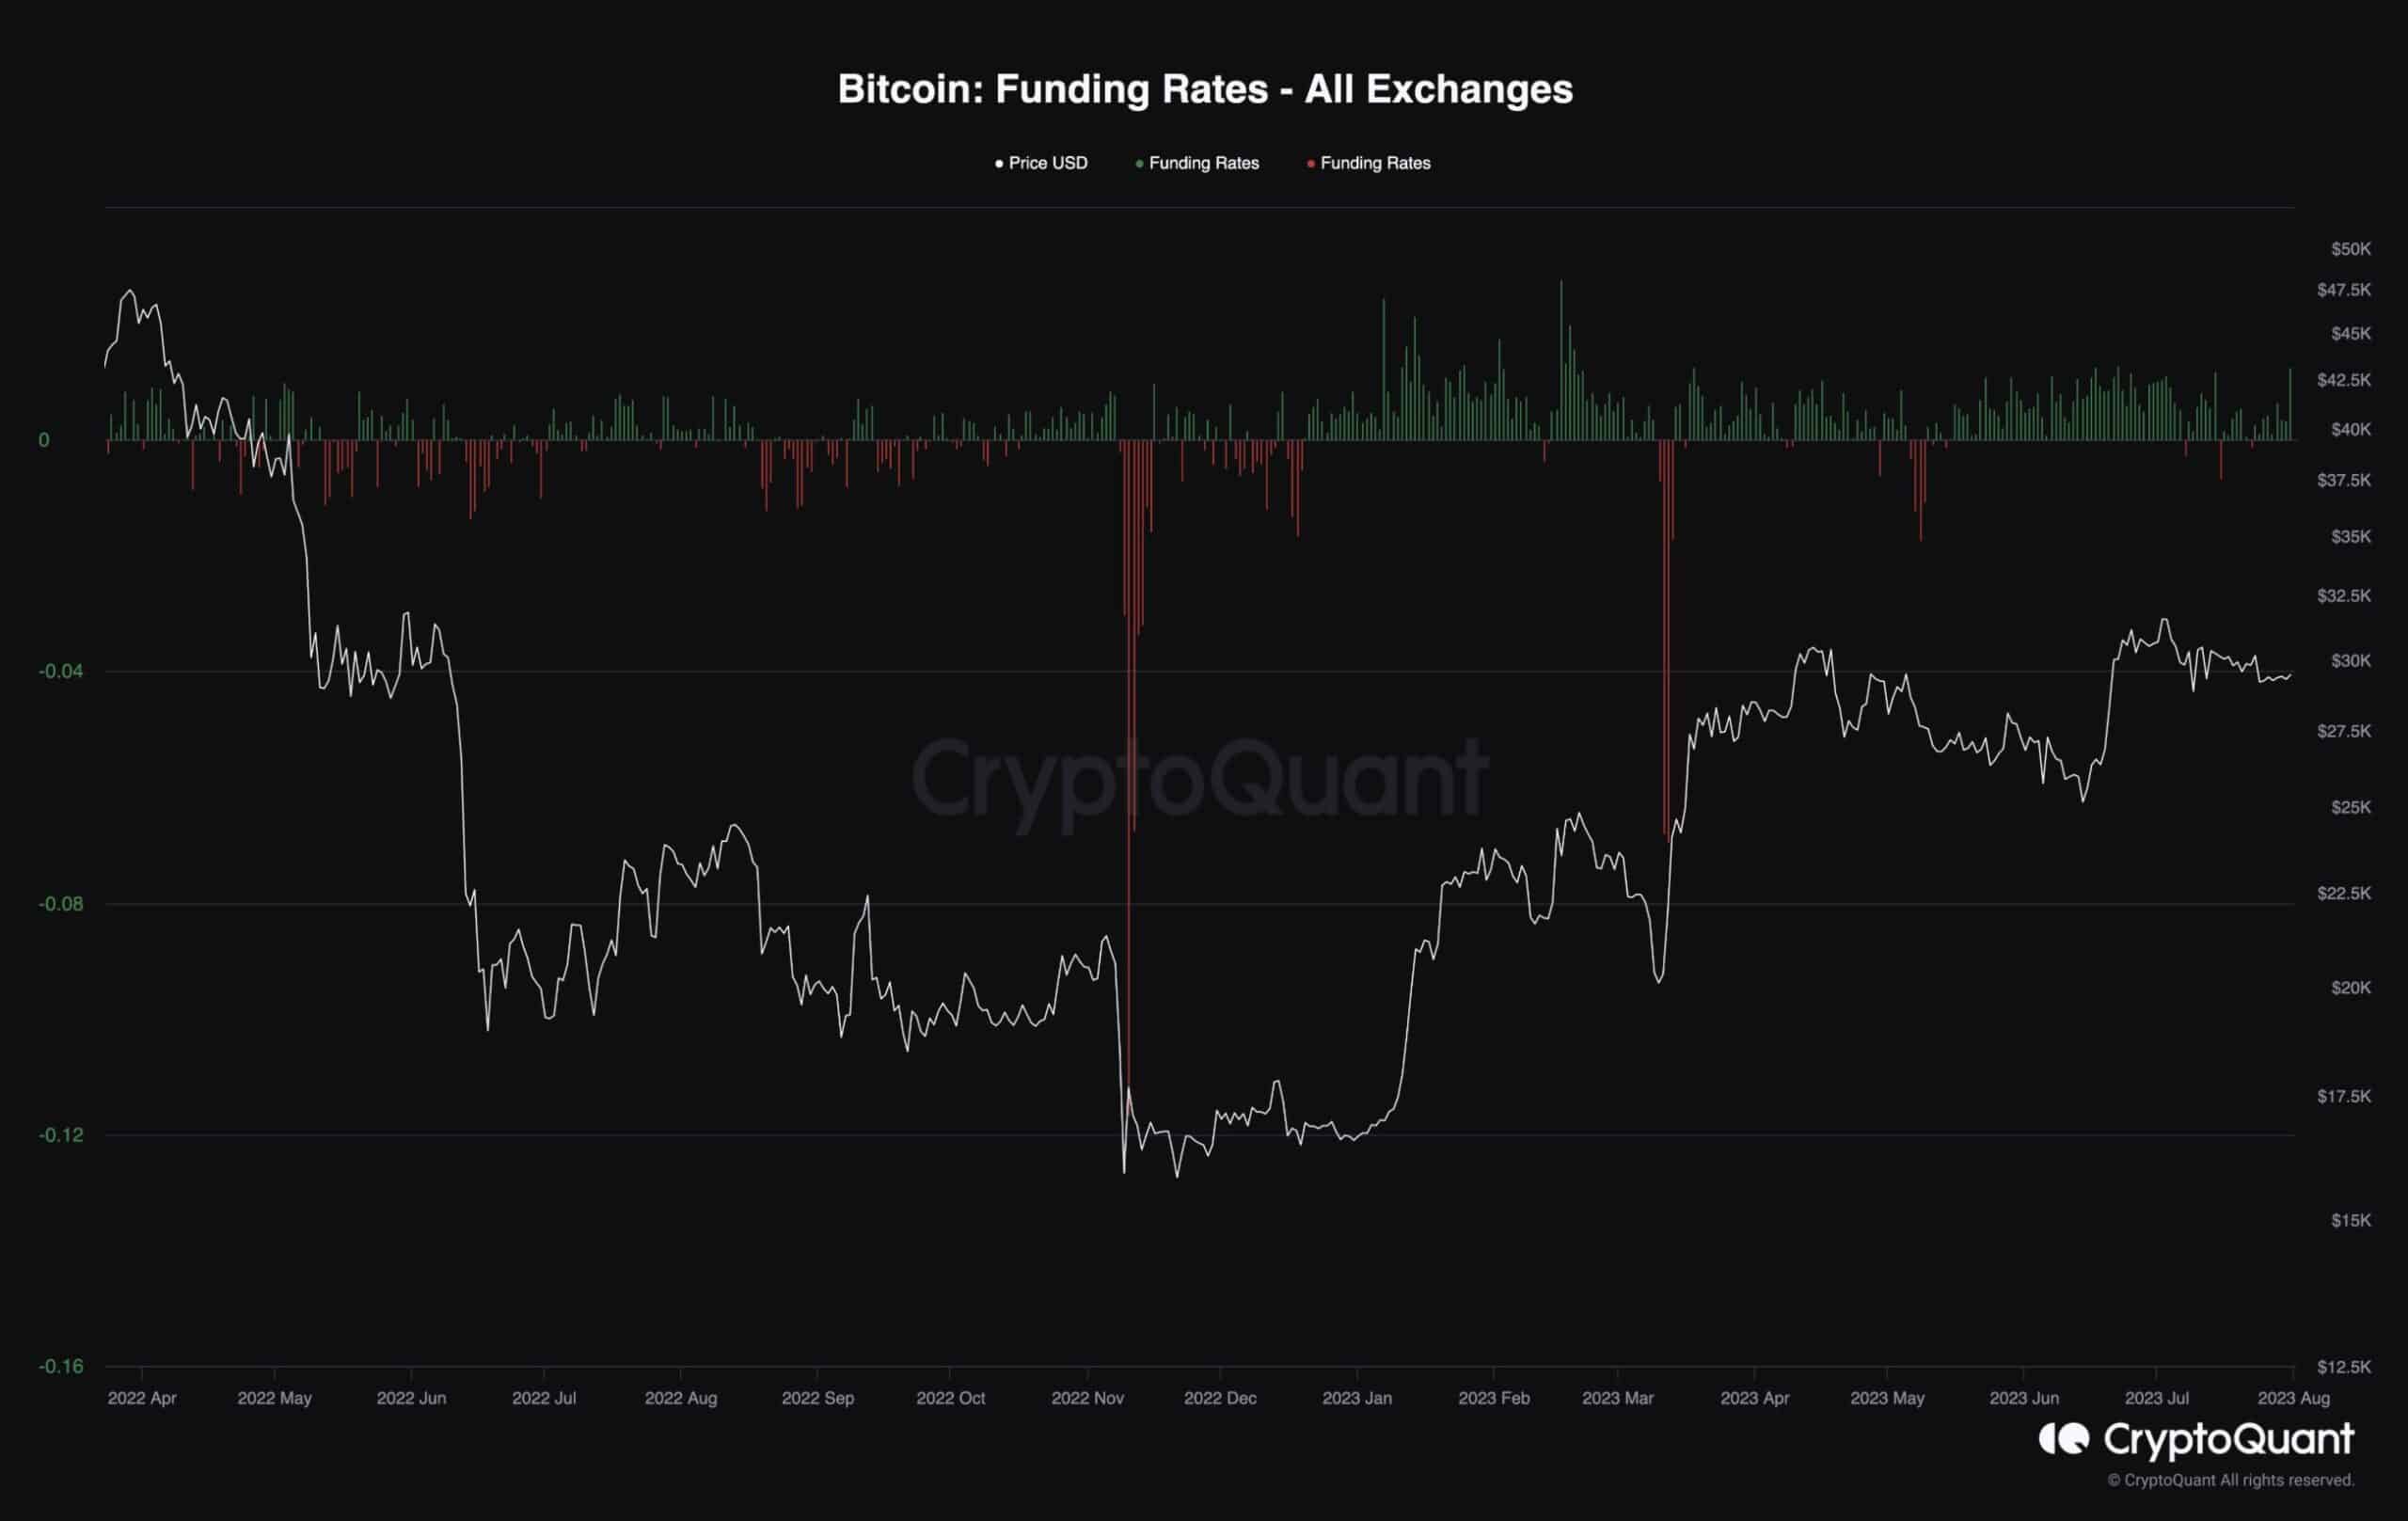
This chart demonstrates the funding rates, which are periodic payments to either long or short traders based on the difference between perpetual contract markets and spot prices.
Funding rates represent traders’ sentiments in the perpetual futures market, and the amount is proportional to the number of contracts. Positive values indicate that long-position traders are dominant and are willing to pay funding to short traders. Negative funding rates indicate that short-position traders are dominant and are willing to pay long traders.
This metric has recently shown positive values, indicating the relatively bullish sentiment in the futures market. It also displayed a huge spike yesterday, but the price is yet to move upward. While positive sentiment is not a bad thing, the price’s failure to climb higher is a red flag. If this pattern continues, the market might drop in the short term, as a long liquidation cascade may be on the horizon.